

Your enterprise prospect's procurement team just sent over a requirements doc. Buried on page four: "Custom reporting dashboards, configurable by our ops team, live within 30 days of contract signing." Your sales lead flags it. Your product manager sighs. Your engineering lead opens a new Jira ticket — the fourteenth one this quarter that reads some variation of "custom dashboard for [customer name]."
This is the moment most SaaS companies quietly lose. Not to a competitor with a better core product, but to the gap between what their platform does and what enterprise customers need it to do. The good news: that gap is now closable without writing a single line of custom code. This guide walks you through exactly how to build custom dashboards inside your SaaS product using Vezel's embedded AI extension layer — from API connection to a live, white-labeled dashboard experience your enterprise customers can self-serve on day one.
The Engineering Tax Nobody Talks About
Most SaaS product leaders know the pain intuitively, but few have put a number on it. Research from McKinsey's technology research consistently shows that engineering teams at growth-stage B2B SaaS companies spend a disproportionate share of their capacity on customer-specific work rather than core product innovation. For many teams, that figure sits between 30 and 40 percent of total engineering output — consumed by one-off requests, custom reporting builds, and bespoke integrations that benefit a single customer.
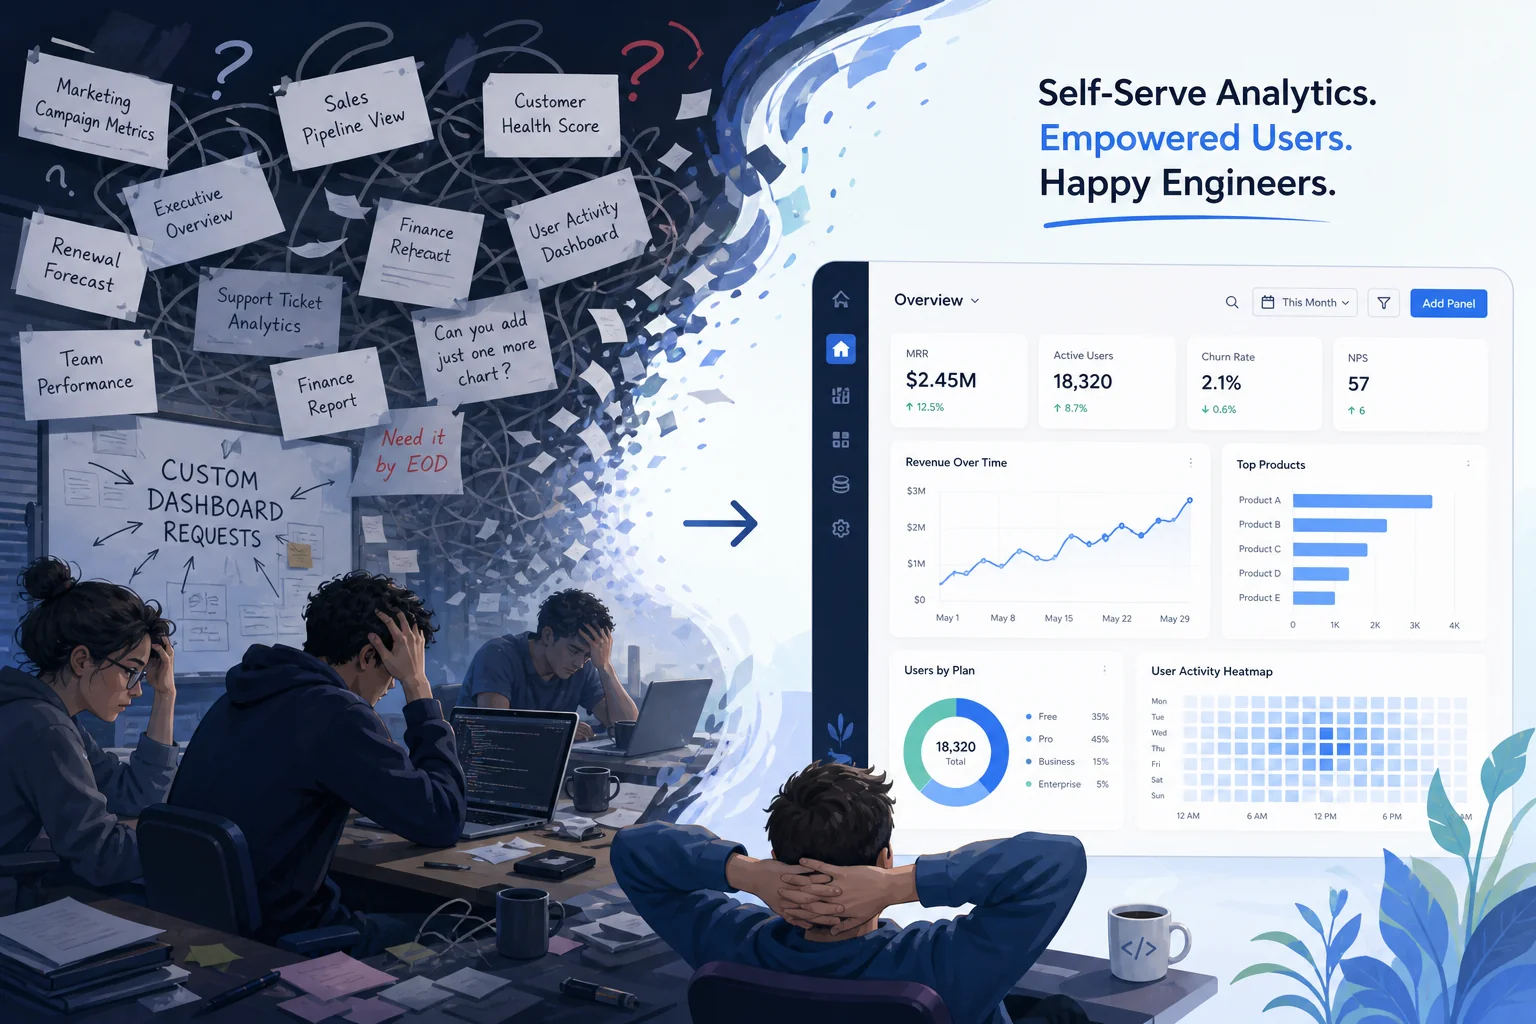
The compounding problem is what happens downstream. Each custom dashboard built for Customer A creates a maintenance obligation. When your data model changes, that dashboard breaks. When Customer A wants a new metric added, another ticket enters the queue. Meanwhile, Customers B, C, and D are filing similar requests. Your roadmap bloats. Your engineers burn out. And your core product, the thing that actually differentiates you, stalls.
The traditional answer has been to say no, or to charge a professional services premium that slows deal velocity. Neither works at scale. The smarter answer is to stop building dashboards for your customers and start giving them the tools to build dashboards themselves, directly inside your product.
What a Native, Embedded Dashboard Builder Actually Looks Like
Before walking through the steps, it's worth being precise about what "embedded" means here, because it's a meaningfully different thing from the standalone tools many teams reach for first.
Tools like Retool or Superblocks are built for internal developer teams to construct internal apps. They live outside your product, require technical users to operate, and produce experiences that look nothing like your platform. Your enterprise customers would never interact with them directly. Glide and Mendix are no-code app builders, but they're standalone products, not something you can embed inside your existing SaaS as a native capability.
Vezel is different in a specific way: it's an embedded AI extension layer that lives inside your SaaS product. Your end-users, the ops manager at your enterprise customer, the analyst, the department head, open your product, navigate to a section you've designated, and find a dashboard builder that looks and feels like it was built by your team. They type what they want in plain English. Vezel's AI translates that into a live data visualization pulling from your platform's actual data. No SQL. No developer involvement. No support ticket.
That's the outcome. Here's how you get there.
1. Connect Vezel to Your Platform's Live Data
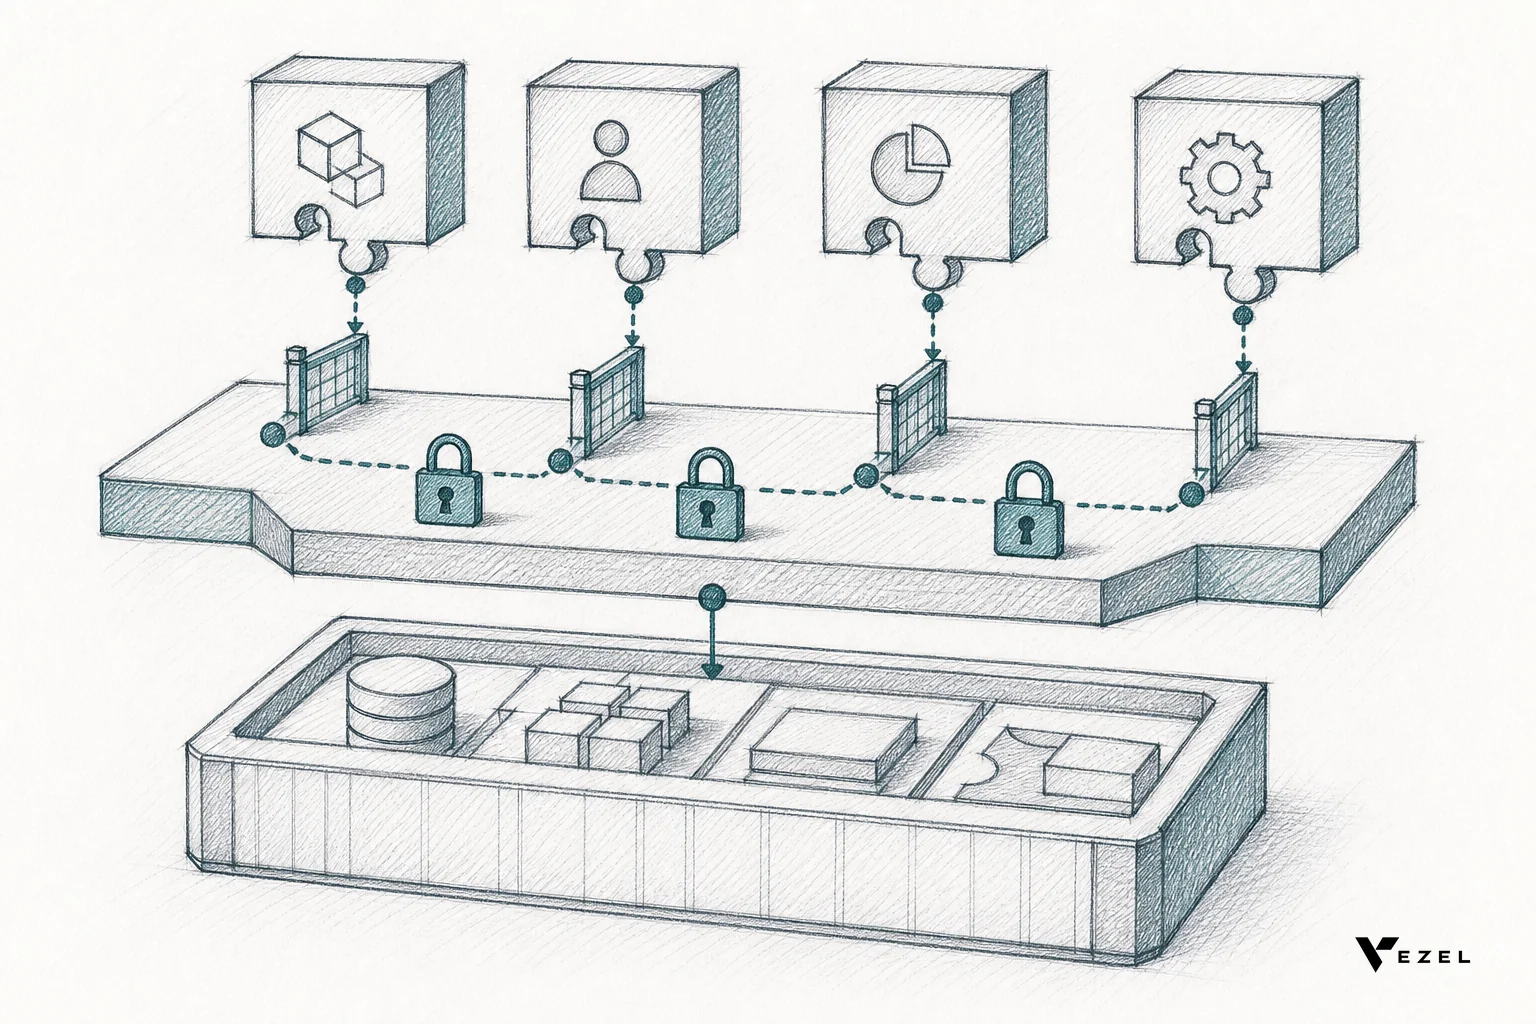
Every Vezel integration starts with an API connection to your existing data layer. Vezel is API-first by design, which means it connects to the data your platform already exposes, it doesn't require you to migrate data, replicate it to a separate warehouse, or restructure your backend.
How the connection works
You register your platform's API endpoints with Vezel's integration layer. This includes your authentication mechanism (OAuth 2.0, API keys, JWT, Vezel supports standard enterprise auth patterns), your base URL, and the endpoints that expose the data objects you want to make available for dashboards. Vezel's zero-footprint architecture means it reads from your live data at query time rather than syncing a copy, so your dashboards always reflect current state.
What the timeline looks like
For most SaaS platforms with a reasonably documented REST or GraphQL API, the initial connection takes hours, not sprints. Teams with well-structured APIs and clear data models have completed this step in a single afternoon. The more complex your data model or the less documented your API, the longer this phase takes, but it's still measured in days, not weeks.
This is the phase where having a clear API contract pays dividends. If your platform's API documentation is sparse, use this integration as the forcing function to clean it up. You'll benefit beyond just the Vezel integration.
2. Define Your Data Schema and Expose the Right Entities
Connecting to your API gives Vezel access to your data. The next step is telling Vezel which parts of that data should be available to end-users building dashboards, and how those data objects should be described.
Mapping your data model to Vezel's entity layer
Vezel uses an entity model to represent your platform's data objects. An "entity" might be a customer account, a transaction, a support ticket, a project, a user, whatever the core objects in your domain are. For each entity, you define which fields are exposed, what they're called in plain English (not your internal database column names), and how entities relate to each other.
This mapping step is where product thinking matters more than engineering. The goal is to expose data in a way that matches how your end-users think about their business, not how your engineers structured the database. If your internal field is acct_rev_usd_monthly, your end-users should see it as "Monthly Revenue." If your internal join table is usr_proj_rel, your end-users should be able to ask "show me projects by team member" without knowing that relationship exists.
Governance starts here
This is also where you make deliberate decisions about what not to expose. Not every field in your data model should be available to every user building a dashboard. Sensitive fields, PII, financial data above certain thresholds, data belonging to other tenants, should be excluded at the entity definition layer. This is your first line of data governance, and it's far easier to get right here than to patch it later.
According to Gartner's data analytics research, one of the top failure modes in self-serve analytics deployments is insufficient data governance at the schema layer, users either can't find what they need because it's not exposed, or they can access data they shouldn't. Getting the entity definition right is the highest-leverage step in this entire process.
3. Configure Permissions and Access Control
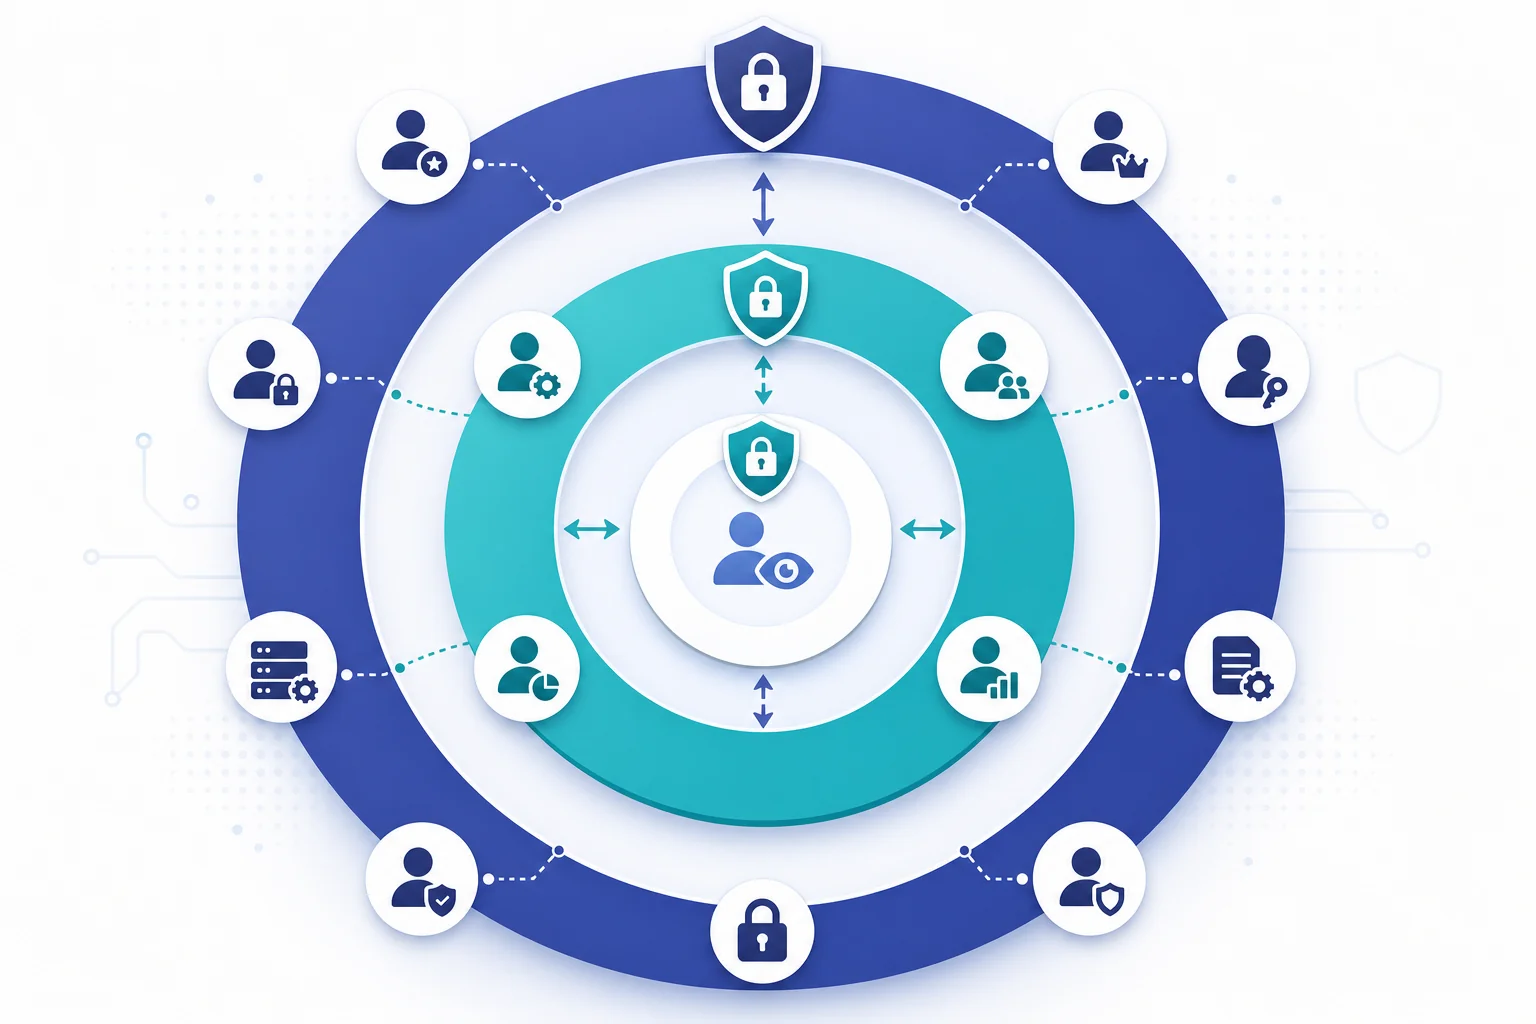
Enterprise customers don't just want dashboards. They want dashboards with guardrails. The ops manager should be able to build and publish dashboards for their team. The analyst should be able to create drafts. The executive should be able to view but not edit. And none of them should ever see data from a different tenant.
Inheriting your existing auth model
Vezel's permission system is designed to inherit your platform's existing authentication and authorization model rather than replace it. If your platform already has roles, admin, manager, viewer, or whatever your taxonomy is, Vezel maps to those roles. Your users don't create a separate Vezel account. They log into your product as they always have, and their existing permissions determine what they can do inside the dashboard builder.
Role-based controls for the dashboard builder itself
Beyond data access, you configure what each role can do within the dashboard builder experience:
- Builders can create new dashboards, use AI prompts, add and arrange components, and save drafts.
- Publishers can promote a dashboard from draft to live, making it visible to their team or the broader organization.
- Viewers can interact with published dashboards, filtering, drilling down, exporting, but cannot modify the layout or create new ones.
- Admins have full lifecycle control: they can archive dashboards, manage templates, and audit usage.
Tenant isolation for multi-tenant architectures
If your SaaS is multi-tenant (and most B2B SaaS products are), Vezel enforces tenant-level data isolation at the query layer. A user at Company A building a dashboard will only ever see Company A's data, even if they construct a query that would theoretically return results across tenants. This isolation is enforced by Vezel's query engine, not just by UI-level filtering, it's a hard boundary, not a soft one.
4. Enable End-Users to Build Dashboards with Plain English Prompts
This is the step that changes the conversation with your enterprise customers. Once your data is connected, your schema is defined, and your permissions are configured, the dashboard builder is live inside your product. Your end-users can start building.
How the AI prompt interface works
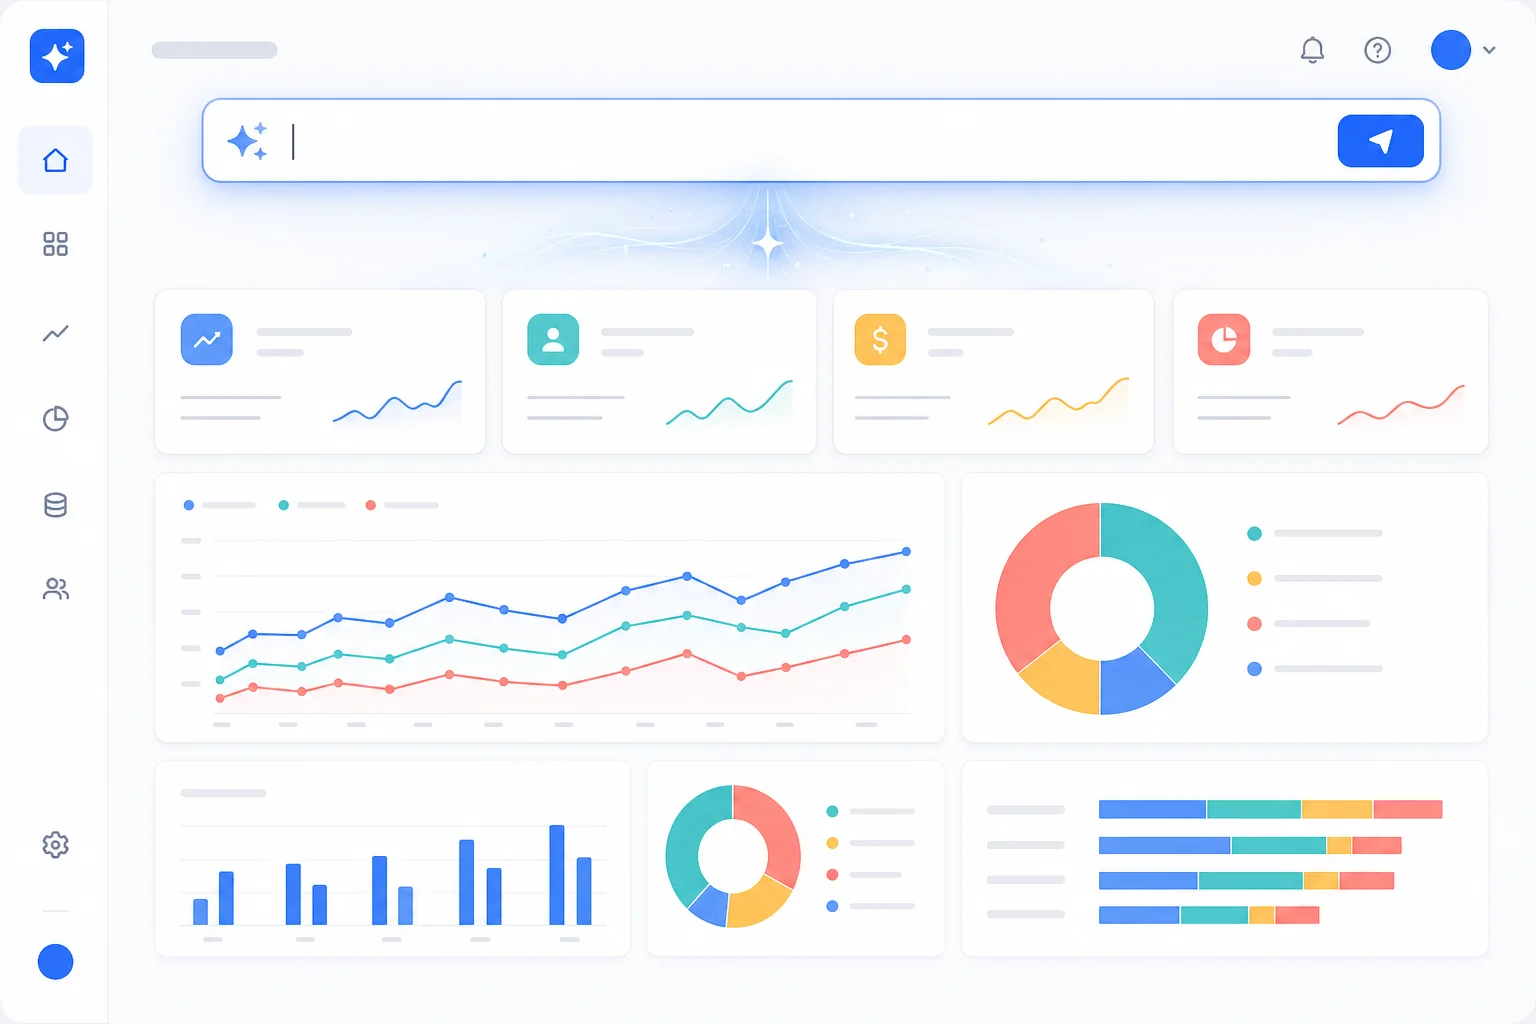
The end-user experience is intentionally simple. Inside your product, users navigate to the dashboard section (which you've named and branded however you like). They see a prompt input and a canvas. They type what they want to see:
"Show me monthly revenue by region for the first half of 2026, broken down by product line."
Vezel's AI parses that request, maps it to the entities and fields you've exposed, constructs the appropriate query against your live data, and renders a visualization on the canvas, a bar chart, a line graph, a table, whatever best fits the request. The user can then refine: "Make it a line chart instead" or "Add a filter for enterprise accounts only." Each iteration updates the visualization in real time.
Beyond prompts: layout and customization
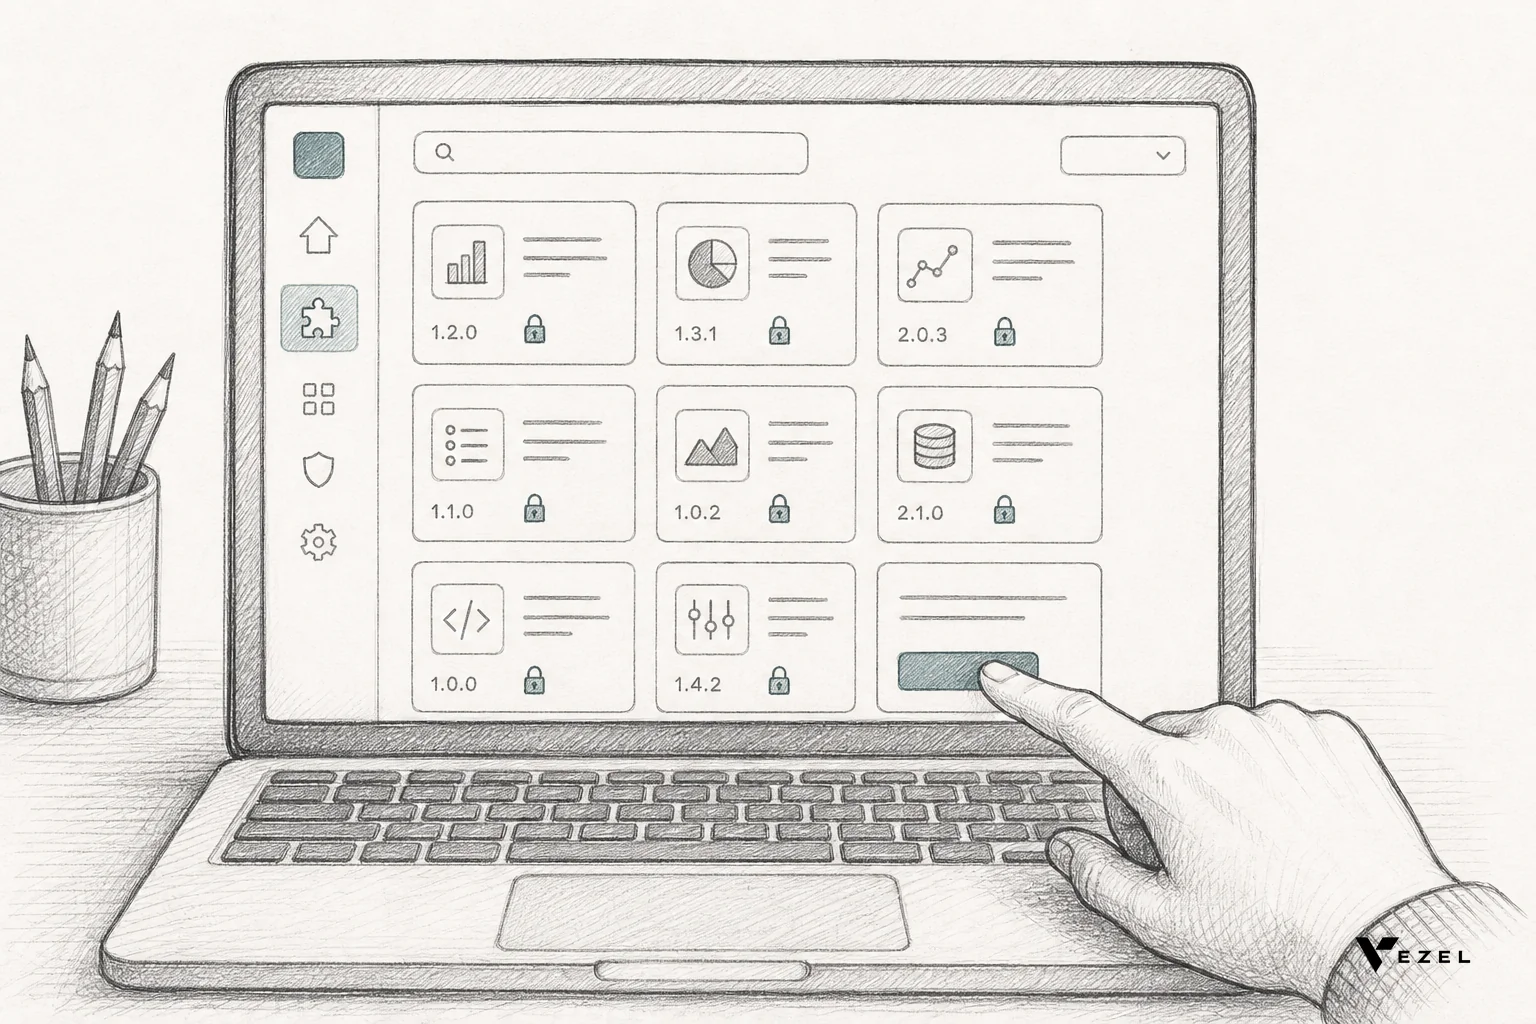
AI-generated components are the starting point, not the end state. Users can drag and drop components to arrange their dashboard layout, resize panels, add KPI cards, set up date range filters, and combine multiple visualizations on a single canvas. The result is a fully custom dashboard that reflects exactly how that user's team thinks about their data, built in minutes, not weeks.
Templates and shared dashboards
Admins can create and publish dashboard templates, pre-built layouts that reflect common use cases for your product. A new enterprise customer onboarding to your platform can start from a template that already shows the five metrics most relevant to their role, then customize from there. This dramatically reduces time-to-value for new users and gives your customer success team a powerful onboarding tool.
5. White-Label the Experience for Your Brand
The dashboard builder your end-users interact with should feel like a native part of your product, not a third-party tool that was bolted on. Vezel's white-labeling capabilities let you apply your product's full design system to the extension layer.
What you can customize
You control the visual presentation of the dashboard builder: your color palette, typography, component styling, icon set, and layout conventions. The prompt input, the canvas, the component library, the publishing controls, all of it renders in your brand's visual language. You also control the naming: call the feature "Analytics Studio," "Insights Builder," "Report Center," or whatever fits your product's terminology. Vezel's name never appears in the end-user experience.
Why this matters for enterprise deals
Enterprise buyers are sophisticated. They notice when a capability feels native versus when it feels like a vendor integration. A white-labeled, native-feeling dashboard builder signals that your platform is a serious, extensible product, not a point solution that outsourced its reporting to a third party. That perception directly affects deal velocity and the price point you can command.
If you're evaluating how to build custom dashboards inside your SaaS product and weighing the build-vs-buy question, consider this: building a comparable native experience from scratch typically takes 6-12 months of engineering time and produces a product that still needs ongoing maintenance. Vezel's embedded approach gets you to the same end-user outcome in days, with zero ongoing engineering overhead for the dashboard builder itself.
6. Go Live and Measure the Impact
The integration is complete. The permissions are configured. The white-labeled experience is live. Now comes the part that actually matters: getting real enterprise customers using it and measuring what changes.
Start with a pilot customer
Resist the urge to roll out to your entire customer base on day one. Pick one enterprise customer, ideally one that has been vocal about needing custom reporting, and give them early access. Work with their team to build their first dashboards together. This gives you real usage data, surfaces any entity mapping gaps you missed, and produces a concrete success story you can use in sales conversations.
Metrics that matter
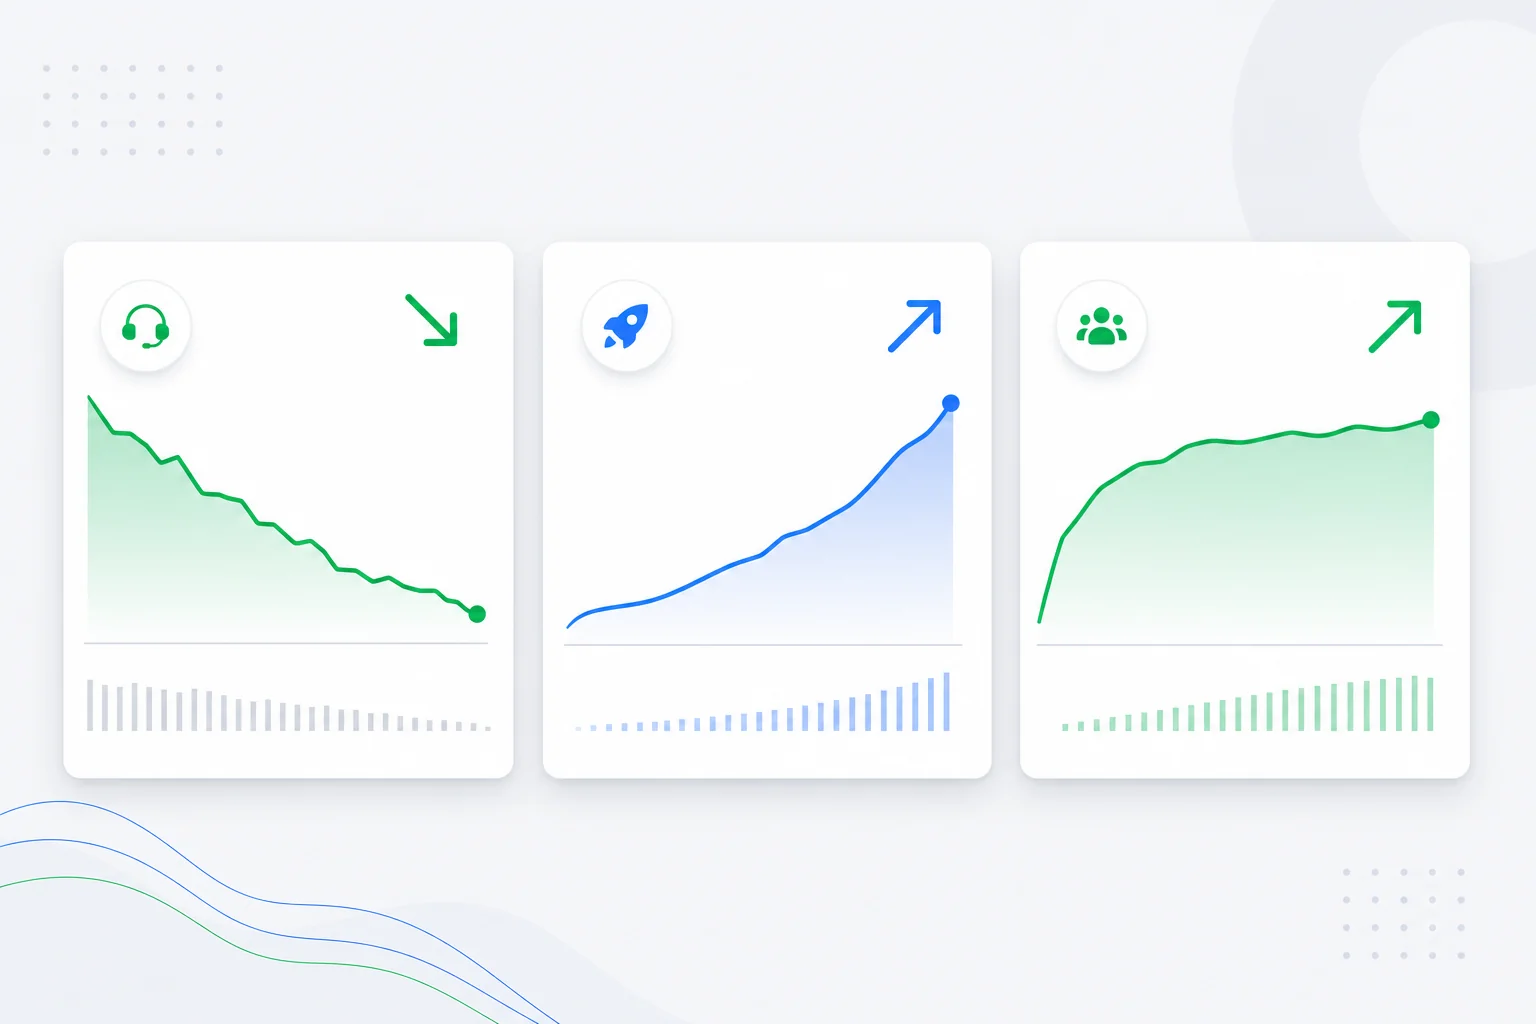
Track these signals in the first 90 days after launch:
- Support ticket volume for custom reporting requests, this should drop significantly as users self-serve
- Time-to-first-dashboard, how long does it take a new user to create their first useful dashboard?
- Dashboard creation rate, how many dashboards are being created per active user per month?
- Feature adoption depth, are users using AI prompts, templates, or both?
- Engineering hours recaptured, track the reduction in custom development requests from the accounts using the builder
Using dashboard data to inform your roadmap
One underappreciated benefit of giving end-users a self-serve dashboard builder is the signal it generates about what your customers actually care about. The metrics they build dashboards around, the queries they ask most frequently, the data they try to access that isn't yet exposed, all of this is a direct window into your customers' priorities. Use it to inform your product roadmap with real demand data rather than anecdotal feedback from your loudest accounts.
Scaling from pilot to platform
Once your pilot customer is successfully self-serving their reporting needs, the rollout to your broader customer base is straightforward. The infrastructure is already in place. You're adding users to an existing capability, not building something new. For enterprise sales, you now have a live, working demonstration of the capability, not a roadmap promise, but a feature you can show in a demo and reference in a case study.
That shift, from "we're building this" to "here's a customer using it today", is often the difference between a deal that stalls and one that closes.
Frequently Asked Questions
How long does the Vezel integration actually take?
For most SaaS platforms with a documented REST or GraphQL API, the initial integration, connecting your data, defining your entity schema, and configuring basic permissions, takes between one and five days of engineering time. The white-labeling and UI configuration can happen in parallel. Most teams are in a position to pilot with a real customer within two weeks of starting the integration.
Do my end-users need any technical skills to build dashboards?
No. The plain English prompt interface is designed for business users, ops managers, analysts, department heads, who understand their data but have no SQL or coding skills. If a user can describe what they want to see in a sentence, they can build a dashboard. The AI handles the translation from natural language to data query to visualization.
What happens if a user builds a dashboard that tries to access data they shouldn't see?
Vezel's permission and tenant isolation layers enforce data access at the query level, not just the UI level. If a user's role doesn't grant access to a particular entity or field, that data simply won't be available in their dashboard builder, they won't see it as an option, and any query that would return it will be blocked before it reaches your data layer. The governance you configure in step 3 is enforced at runtime, not just at design time.
Can I control which customers have access to the dashboard builder?
Yes. You can gate access to the dashboard builder by customer tier, account type, or any other attribute in your platform's user model. Many SaaS companies use this as a packaging lever, offering the self-serve dashboard builder as a premium feature for enterprise tiers, which both increases the value of those tiers and creates a natural upgrade path for mid-market customers who want the capability.
How is Vezel different from just building a reporting module ourselves?
Building a reporting module in-house means your engineering team owns the entire stack: the query engine, the visualization library, the permission system, the AI layer, the white-labeling, and all future maintenance. That's a 6-12 month build for a v1 that will still require ongoing investment. Vezel gives you all of that as an embedded layer that integrates with your existing platform, your engineers spend days on integration, not months on construction. The ongoing maintenance of the dashboard builder itself is Vezel's responsibility, not yours. Your team stays focused on your core product.
Your Enterprise Customers Are Ready to Self-Serve. Is Your Product?
Every enterprise deal you're working right now has a version of the same requirement buried somewhere in the discovery notes: custom reporting, configurable dashboards, data visibility that maps to how their team actually works. The question isn't whether your customers want this capability. They do. The question is whether you can deliver it without trading your engineering roadmap for it.
Vezel makes it possible to build custom dashboards inside your SaaS product, and hand that capability directly to your enterprise customers, without writing custom code, without draining your dev team, and without the 12-month build cycle that makes most product leaders file this under "future roadmap." It's a live capability you can pilot with a real customer in weeks.
If you're ready to see exactly how the integration works for your specific platform, book a demo with the Vezel team, we'll walk through your data model, your permission requirements, and what a white-labeled dashboard experience would look like inside your product. Or if you'd prefer to explore the mechanics first, start your free trial and connect your first data source today. Either way, the engineering tax on custom dashboards ends here.
Questions about your specific architecture or enterprise requirements? Talk to an expert on the Vezel team, no sales pitch, just a technical conversation about what's possible.