



An executive sales review dashboard for CRM fits on one screen and shows leadership six things: revenue against target, weighted forecast against the committed number, pipeline coverage, win rate, sales cycle length and stage conversion. Rep-level reporting works on individual deals. The executive view works on totals, trends and risk, for US SaaS teams and everyone else.
Key takeaways
- Grain decides everything: executives act on aggregates (totals, rates, trends), while reps act on single records (this deal, this next step).
- Start with six headline metrics: revenue vs target, weighted forecast vs commit, pipeline coverage, win rate, cycle length and stage conversion. Add days in stage and win rate by source only after the first six are trusted.
- Live data beats exports: the dashboard should read the pipeline through the CRM's own APIs, so the Monday review never opens with "which export is this?"
- Permissions must carry over: a leadership view should inherit the roles your CRM already enforces, not introduce a second access model.
- No BI project needed: with Vezel, a CRM product team can generate this dashboard inside the product from a plain-English request. Setting up the control plane review queue usually takes 7 days.
Executive sales review dashboard at a glance
| Element | What leadership sees | Why it earns a place |
|---|---|---|
| Revenue vs target | Closed revenue to date against the period goal | The one number every review starts with |
| Weighted forecast vs commit | Probability-weighted pipeline next to the number the team committed | Shows whether the commit is believable |
| Pipeline coverage | Open pipeline relative to the remaining target | Warns of a gap before the quarter ends |
| Win rate | Share of closed deals won, by segment or source | Shows what is converting |
| Cycle length and stage conversion | Time to close and drop-off between stages | Finds where deals stall |
| Access | Inherits existing CRM roles and permissions | No second security model to audit |
If you build or run a CRM product, this guide is for you. It covers what leadership needs, how that differs from the reporting your reps use daily, and how to ship the view without a custom BI project. Our team at Vezel builds these inside the host product, so we will say where that fits as we go.
What is the difference between an executive sales review and rep-level reporting?
An executive sales review looks at aggregates over a quarter or a month, such as revenue, forecast, coverage and win rate. Rep-level reporting looks at individual records, such as one deal's next step or one rep's activity today. Same CRM data, different grain, different audience, different decisions.
The simplest test is the question each view answers. A rep asks, "What do I do next on this account?" A VP asks, "Will we hit the number, and if not, where is the gap?" One needs a list. The other needs a picture.
Side-by-side: what each audience needs
| Audience | Timeframe | What they need | What to leave out |
|---|---|---|---|
| Rep | Today and this week | Open deals, next steps, overdue tasks, deal-level notes | Company-wide totals |
| Manager | The quarter | Stage conversion by rep, cycle length, qualification completeness, coaching signals | Raw activity counts and vanity totals |
| Executive | Quarter, year, trend | Revenue vs target, forecast vs commit, coverage, win rate | Individual deal records and task lists |
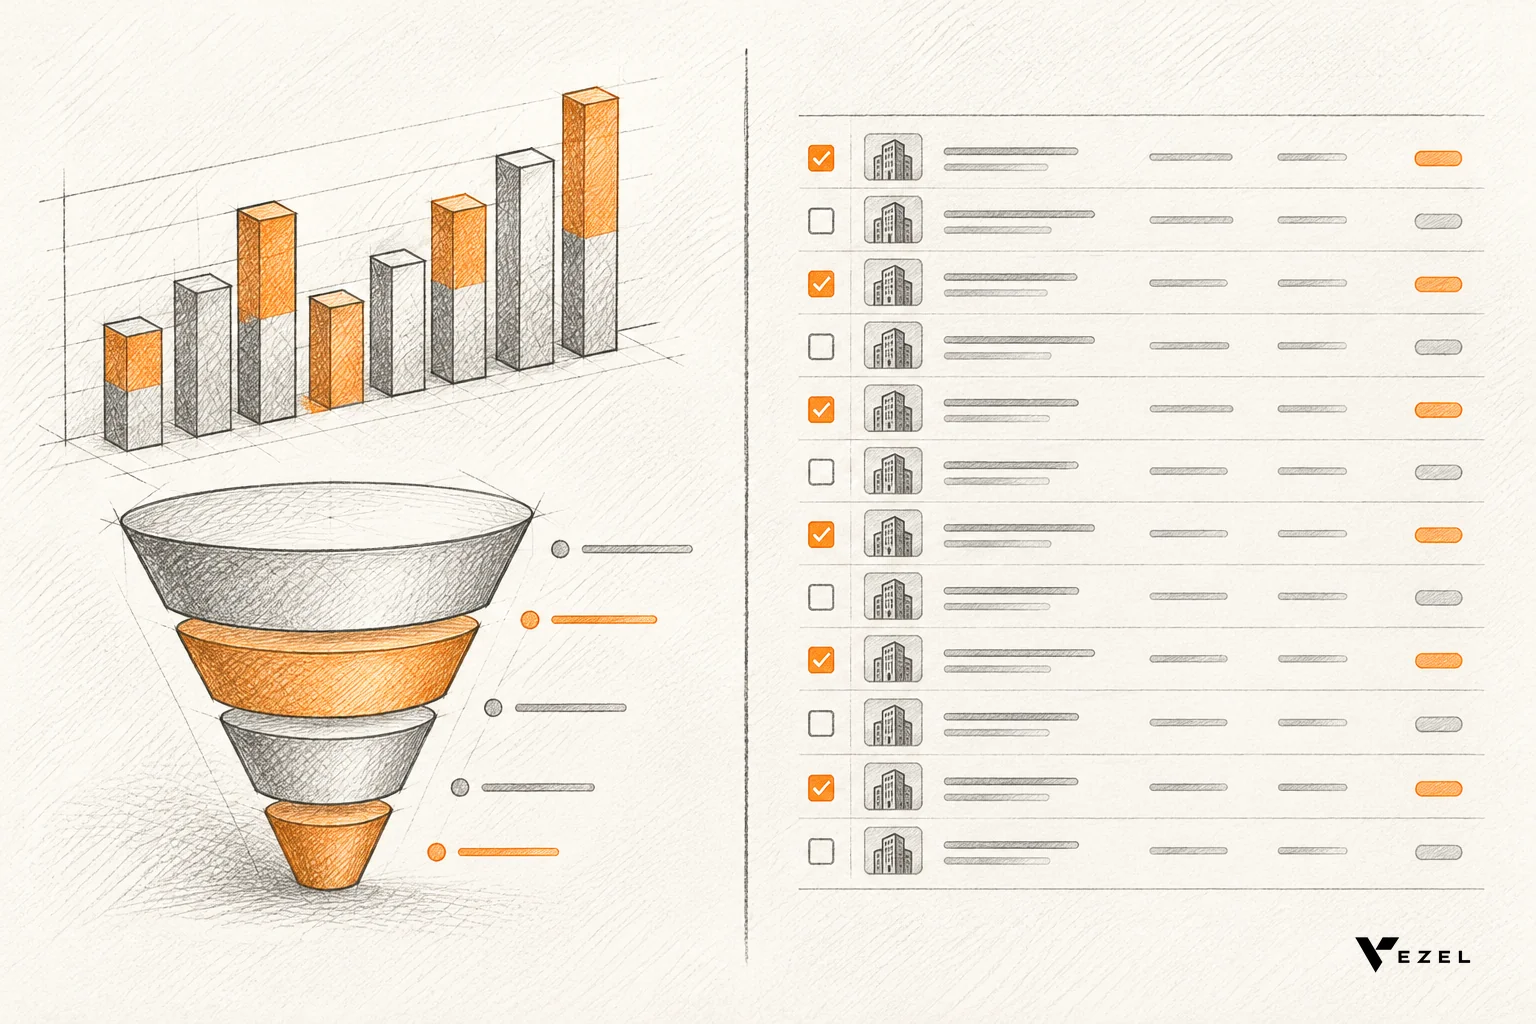
Mixing the two is the most common beginner mistake. A dashboard that shows every open deal to a CEO buries the signal. A dashboard that shows only totals to a rep gives them nothing to act on. Build separate views from the same live data.
Why this matters for CRM product teams
If you sell a CRM, your customers' leaders will ask for their own version of this screen. Each asks for slightly different metrics, and each request lands on your roadmap. We cover that pattern in more depth in how CRM SaaS platforms can offer custom reporting.
Dashboards like this have a long history in sales operations. A UC Berkeley School of Information project built a web-based executive dashboard for the Global Sales Operations group at Sun Microsystems, with role-based information as a core requirement. The need for a leadership view with controlled access is not new. Delivering it quickly inside the product is the part that has changed.
Which metrics belong on an executive sales review dashboard for CRM?
Six metrics belong on the first screen: revenue against target, weighted forecast against the committed number, pipeline coverage, win rate, sales cycle length and stage conversion. Together they answer whether the team will hit its number and, if not, where the gap sits. Everything else is a drill-down.
Here is what each one does and what a good reading looks like in words, since healthy ranges differ by company, deal size and sales motion.
1. Revenue against target
Closed revenue to date, next to the goal for the period. Show the gap as a number and as a percentage. This sits top left because every review starts here, and it needs no explanation.
2. Weighted forecast against commit
The forecast is open pipeline weighted by stage probability. The commit is the number the sales leader has told the business to expect. Put them side by side. If the weighted forecast sits well below the commit, the review should spend its time there.
3. Pipeline coverage
Coverage compares open pipeline to the remaining target. Formula: coverage = open pipeline ÷ remaining target. Pass mark: coverage that fits your own history of win rates. We cite no universal benchmark, because healthy ratios differ by company. As a rule of thumb, the lower your win rate, the more coverage you need: roughly the inverse of your win rate. Walk away from any coverage figure that counts stale or unqualified deals.
Worked example (illustrative numbers only). Suppose the quarterly target is 1,000,000 and closed revenue to date is 400,000. The remaining target is 1,000,000 − 400,000 = 600,000. Open pipeline is 1,800,000, so coverage is 1,800,000 ÷ 600,000 = 3.0x. If you win about one in three opportunities, the inverse is 3x, so coverage is just enough, with no margin.
Weighted forecast = the sum of each deal's amount × its stage probability. Here is a sample stage-probability table. The probabilities are examples; use the ones your team agreed.
| Stage | Open amount (example) | Probability (example) | Weighted amount |
|---|---|---|---|
| Discovery | 800,000 | one-tenth | 80,000 |
| Proposal | 600,000 | three-tenths | 180,000 |
| Negotiation | 400,000 | six-tenths | 240,000 |
| Total | 1,800,000 | 500,000 |
In this example the weighted forecast is 500,000 against a remaining target of 600,000. If the commit is 600,000, the review should spend its time on the 100,000 gap.
4. Win rate
Win rate is closed-won divided by all closed deals in the period. Slice it by lead source, segment or deal size. Win rate by source is especially useful because your best leads may not come from your biggest channel.
5. Sales cycle length
Average days from creation to close, trended over several periods. A rising line on its own is a warning. A rising line in one segment tells you where to look.
6. Stage conversion
The percentage of deals that move from one stage to the next. It shows where the funnel leaks. Pair it with days in stage, which flags deals that sit too long and are quietly dying.
A sample weekly review walk-through
Using the illustrative numbers above, a Monday review runs in order. Revenue is 400,000 of 1,000,000, or 40% of target. Coverage is 3.0x. Weighted forecast is 500,000 against a 600,000 commit, a 100,000 shortfall. The question for the room: which Negotiation deals can close, or which Proposal deals can move forward? Stage conversion and days in stage then show where to look.
Optional second-row metrics
- Quota attainment to date: useful once reps are on comparable quotas.
- New vs expansion revenue: useful if your customers sell to existing accounts.
- Forecast accuracy over time: how close last quarter's commit landed to the actual number.
What to leave off the page
Calls made, emails sent and total records created are rep tools, not leadership signals. Leave them out. If an executive asks for one, treat it as a sign they need a manager-level view, not a longer executive one.
How should the views be laid out for a weekly review?
Put the headline numbers in a top row, a trend chart beneath them, then a funnel and a short list of at-risk segments. Leaders should read the whole screen in under a minute. Anything that needs scrolling or explanation belongs in a drill-down, not on the front page.
Keep the layout fixed and review it on a fixed cadence, weekly or monthly. A dashboard that changes shape each week makes trends hard to read. Label every metric with its definition in a tooltip, so "win rate" means one thing across the room.
One thing is not settled here: metric definitions. Whether a deal counts toward coverage at the proposal stage or only at negotiation is a choice each company makes. Write it down before you build, because the dashboard will make that choice for you otherwise.
How do you generate the dashboard from live pipeline data?
Connect the dashboard to the CRM's own APIs so it reads live pipeline records, then describe the view you want in plain English and let the platform generate it inside the product. With Vezel, most SaaS platforms can integrate in a few days, with no separate BI stack to build.
Vezel works in four steps: connect to your APIs, generate extensions from plain English, run them ready to use in a secure container, then scale and govern. For an executive sales review, that looks like this.
- Connect to your APIs. Vezel integrates with your product's APIs and data models using a zero-footprint setup, so opportunities, stages, owners, amounts and close dates are available to the extension.
- Write the request. Describe the review in plain English. For example: "Show closed revenue against this quarter's target, the weighted forecast next to the commit, pipeline coverage, win rate by lead source, average cycle length and stage conversion. Refresh live."
- Check the draft in the secure container. Compare each number to a report you already trust before anyone else sees it.
- Publish through governance. Publishing, permissions, approvals and the extension lifecycle are managed from a central control plane.

Pass and fail checks before you publish
- Totals match: closed revenue on the dashboard equals your finance or CRM report for the same period. If it is off, stop and fix the field mapping.
- Stages map correctly: every pipeline stage has the probability you agreed. A missing stage means a wrong forecast.
- Refresh is live: change a deal amount in the CRM and watch the dashboard move. If it only updates overnight, you have built a scheduled report.
- Definitions are visible: each metric has a plain definition on screen.
The live-versus-scheduled question deserves its own look. We compare the two in real-time dashboard builder vs scheduled report exports. For an executive review, we would pick live every time, because stale numbers cost the room's trust fast.
Why this avoids a custom BI project
A traditional route means a data warehouse, a BI license and an analyst to maintain it. That can be right for company-wide analytics. For a sales review view inside your own CRM, it is more than you need. The executive sales review is one of the use cases Vezel documents for CRM and customer success teams, alongside customer health dashboards, renewal workspaces and territory planning.
Other teams have found that the hard part is the data feed, not the chart. A Drexel LeBow case study on Clarivate Analytics describes students and a sales operations leader designing a sales dashboard and finding a new way to distribute client data to the sales team. The lesson holds: settle who sees what, then build.
If you want to build more of these inside your product, our guide on how to build custom dashboards inside your SaaS covers the general pattern.
How do you keep access inside existing roles and permissions?
Build the dashboard as an extension that inherits your product's existing authentication, permissions and access controls, rather than creating a separate login or data copy. Each viewer then sees only what their CRM role already allows, and no second security model needs auditing.
This matters more for executive views than for most. They roll up data across teams, regions and sometimes customers. If the rollup ignores permissions, a regional manager might see totals that include accounts they cannot open.

Checks to run on access
- Log in as an executive: you should see company-wide totals. Pass: numbers match the unrestricted report.
- Log in as a regional manager: you should see only your region's data. Pass: totals shrink to your scope. Fail: any figure that includes accounts you cannot open in the CRM.
- Log in as a rep: you should see no leadership view at all, or only your own numbers. Fail: any peer's deal data.
If a check fails, do not publish. Fix the permission mapping, test again, and only then release it through the control plane. Extensions are also white-labeled, so the finished view looks and feels like a native part of your CRM, not a bolted-on tool.
Governance without a long queue
Publishing, permissions and approvals sit in one place, the central control plane. Setting up its review queue usually takes 7 days. That gives a product leader one place to see which dashboards exist, who approved them and which are still in use.
If shadow spreadsheets are already the executive reporting layer at your customers, how to prevent shadow IT in your SaaS platform explains why a governed in-product view tends to replace them.
Common beginner mistakes and what to build first
Most first dashboards fail the same few ways: too many metrics, undefined terms, stale data and no clear owner. Build the six headline metrics first, with written definitions, live data and one named owner for the view. Add detail only after leaders use the first version weekly.
- Too many tiles: if the screen needs a tour, cut it. A dashboard that tries to serve everyone serves no one.
- Undefined terms: two leaders reading "pipeline" differently will argue about the dashboard instead of the business.
- Exports pasted into slides: the numbers are old by the time the meeting starts.
- Rep metrics on the executive screen: activity counts crowd out the forecast.
A decision rule for who builds what
If your CRM team needs the view for its own leadership, or for customer leaders who all ask for roughly the same thing, build it as an in-product extension. If a customer needs deep cross-system analytics that go well beyond sales data, a BI tool may still fit alongside it. We would start with the in-product executive view in almost every case, because it ships quickly and teaches you which metrics people actually open.
That is the point of the build, learn, evolve model: ship it as an extension, watch usage, and promote it to a core feature only if many customers use it. Usage informs the roadmap; your product team still makes the call.
FAQ
What is a dashboard for CRM?
A dashboard for CRM is a live screen that turns pipeline, account and activity records into charts and totals for a specific audience. An executive version shows revenue, forecast, coverage and win rate. A rep version shows deals and next steps. Both read the same underlying CRM data.
How often should leadership review the dashboard?
Review it on a fixed weekly or monthly cadence, matched to your sales cycle. Weekly suits shorter cycles and quarter-end pushes. Monthly suits longer enterprise cycles. The dashboard should refresh automatically, so the meeting starts from current numbers instead of a fresh export.
Can this work without changing our core CRM code?
Yes. Vezel integrates with your product's APIs and data models with a zero-footprint setup, and generated extensions inherit your existing authentication and permissions. Scope still depends on which APIs your product exposes, so we usually start with a pilot on one high-value use case.
Build your executive sales review dashboard for CRM
A good leadership view is small: six metrics, live data, clear definitions and the roles your CRM already enforces. You do not need a BI project to get there. If you want to see an executive sales review generated inside a CRM from a plain-English request, book a demo with Vezel and bring one real pipeline question. You can also see how it works first, step by step.