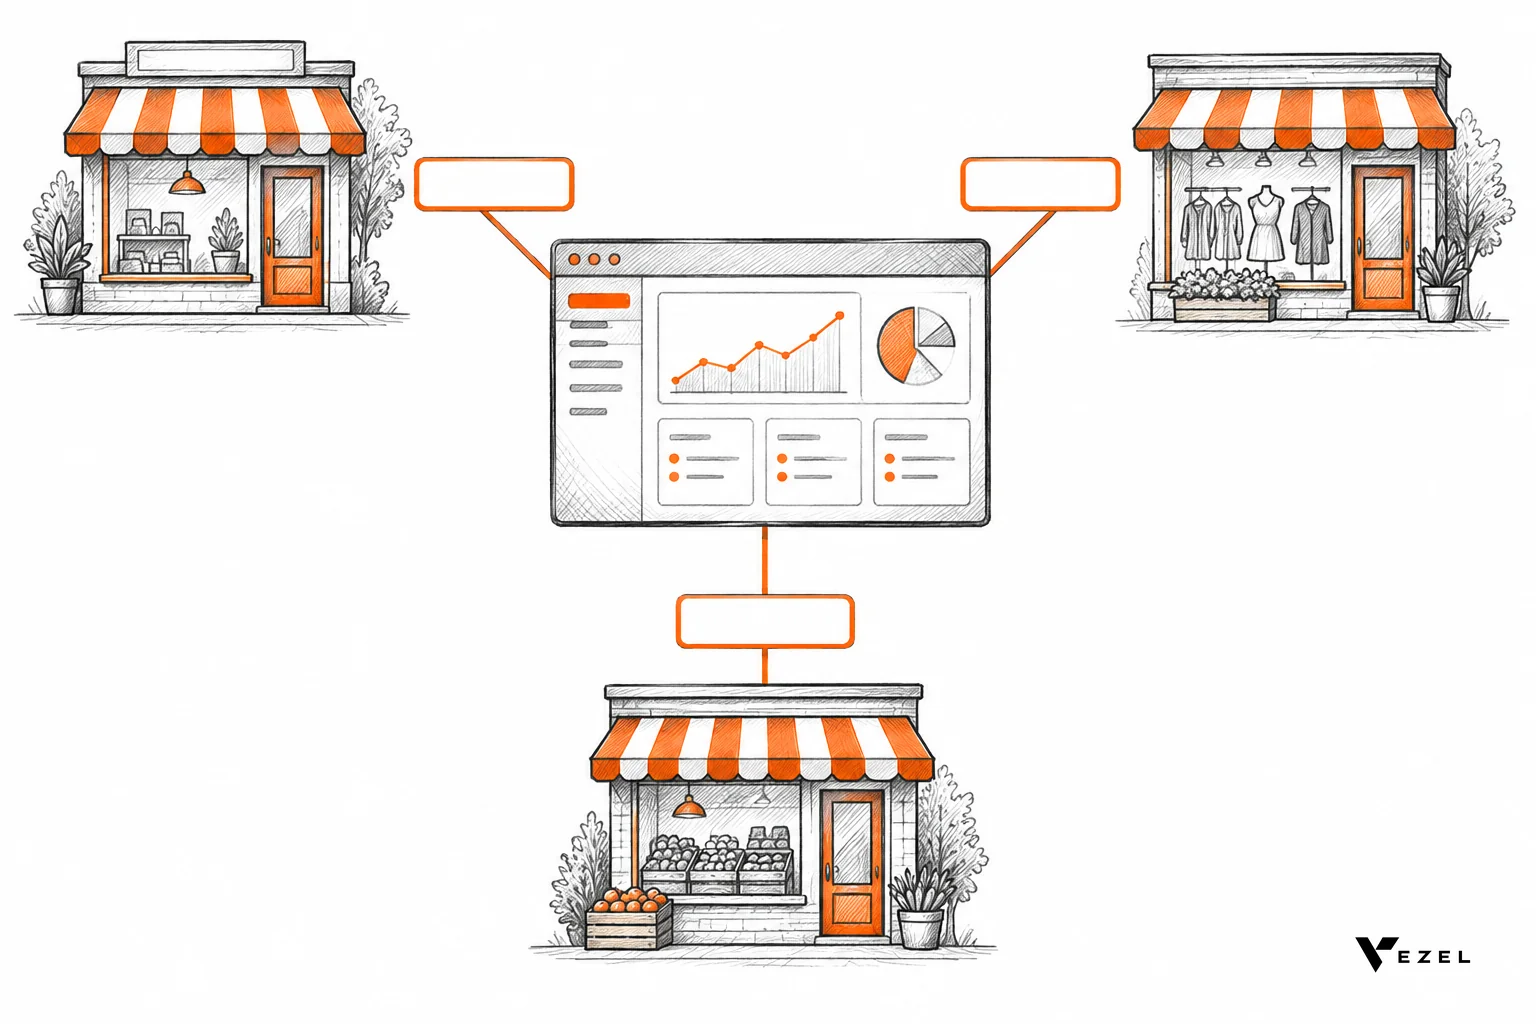



Embedded analytics puts dashboards and reports inside your SaaS product, so customers see their own data without leaving it. US SaaS teams usually pick from three approaches: iframe BI embeds (fastest to launch), native SDK dashboards (most control) and customer self-built dashboards (most personal). Most mature products combine two. Tenant security and licensing model drive cost more than chart count does.
Key Takeaways
- Three real options: iframe embeds win on speed, native SDK dashboards win on look and control, and customer-built dashboards win on fit for each business.
- Security decides the architecture: every query must be scoped to the tenant and the user before a chart renders, not after.
- Cost is mostly recurring: licensing model, engineering upkeep and support load outweigh the one-time build.
- Our recommendation: ship a small set of standard dashboards natively or by embed, then let customers build the long tail themselves.
Embedded Analytics Approaches at a Glance
| Approach | Who builds the dashboards | Speed to launch | Main cost driver | Best fit |
|---|---|---|---|---|
| iframe BI embed | Your team, in a separate BI tool | Fastest of the three | Per-user or per-embed licensing | Proving demand quickly |
| Native SDK dashboards | Your engineers, in your front end | Slowest of the three | Ongoing engineering upkeep | Core, high-traffic reports |
| Customer self-built dashboards | Your customers, in plain English | Days for most SaaS platforms, per Vezel | Governance and review of what customers publish | Customer-specific KPIs |
| Hybrid of two | Your team for standard, customers for the long tail | Phased | Both of the above, smaller each | Most B2B products past early stage |
What Is Embedded Analytics in a SaaS Product?
Embedded analytics is the integration of charts, dashboards and reports directly into an application, so users analyze data in the workflow where it is created. The data stays live and tied to the user's account. It replaces exports to spreadsheets and logins to a separate BI tool.
The difference from classic BI is context. An NYU technical page on reporting alternatives describes embedded BI as placing visuals and reports directly in an application's interface, with context-aware analytics, instead of acting as a set-apart document. That framing is the heart of it: the analytics belong to the product, not the other way around.
It also reaches past charts. A SaaS enterprise application standard hosted at Virginia Tech lists forecasting, decision support, anomaly detection and summarization among the business use cases embedded intelligence can support. Dashboards are the entry point, and intelligence layers on top.
What Do SaaS Customers Expect From Embedded Analytics?
Customers expect live data in the product, their own metrics rather than generic ones, your brand's look and feel, and the ability to ask for a new view in plain language. They no longer accept a canned set of charts and a request ticket for anything else.
The reason is simple: every business measures differently. Two sales teams on the same CRM can define pipeline health differently, one by conversion rate and the other by deal velocity. A shared dashboard serves the average customer and fits nobody exactly. We call that distance the SaaS Adaptation Gap.
AI raised the bar further. Once users could ask a chatbot a question in natural language, they began asking software for a persistent capability: a supplier scorecard, a team KPI view, a morning summary. A one-off answer helps once. A dashboard they open every Monday keeps paying back.
If your customers already export data to spreadsheets, that is the clearest signal of unmet demand. Our post on signs your SaaS product needs live embedded reporting walks through the others.

The Three Approaches Compared
Each approach trades speed, control and flexibility differently. The table below puts the attributes that matter most to a product team on one screen. We stay neutral on named BI vendors here, because the pattern holds whichever tool sits behind the embed.
| Attribute | iframe BI embed | Native SDK dashboards | Customer self-built |
|---|---|---|---|
| Look and feel | Limited theming; often feels like a second product | Matches your design system fully | White-label theming so it matches the host |
| Authentication | Separate session or signed token passed to the BI tool | Uses your existing session | Inherits your existing authentication |
| Tenant isolation | Configured in the BI tool and kept in sync with your app | Enforced in your own query layer | Inherits your permissions and access controls |
| Engineering effort | Low at first, grows with custom needs | High, and ongoing | Integration once, then low per request |
| Customer flexibility | Edit within BI tool limits | Only what you build | Any dashboard a customer can describe |
| Typical weakness | Duplicated permission logic | Every new chart is a ticket | Needs governance over what gets published |
Approach 1: iframe BI Embeds
An iframe embed drops a dashboard from a separate BI tool into a frame inside your app. You build the dashboards there, generate a signed link or token per user, and the frame renders the result. It is the quickest way to get charts in front of customers.
The catch is the seam. Navigation, fonts and filters often look slightly off, and users notice. Permissions also live in two places, your app and the BI tool, so they can drift apart. That drift is the most common source of cross-tenant leaks in this model.
Choose it when you need to test whether customers want analytics at all, or when a small internal team will author every dashboard.
Approach 2: Native SDK Dashboards
Native SDK dashboards render charts as components inside your own front end, fed by your own API. You control every pixel, every interaction and every query. Customers cannot tell analytics from the rest of your product, because it is the rest of your product.
The price is engineering time. Each new chart type, filter or export is work your team schedules, tests and maintains. Native fits the five or six reports every customer opens daily. It fits poorly for the hundred variations different customers want.
Approach 3: Customer Self-Built Dashboards
In this model, customers describe the dashboard they want in plain English and the product generates it inside your app, bound to live data. Vezel is built for this approach. The flow has four steps: connect to your APIs, generate extensions from plain English, run them ready to use in a secure container, then scale and govern.
The dashboards inherit your authentication, permissions and access controls, so a customer only ever sees what their account could already see. Vezel says most SaaS platforms can integrate it in a few days. See how it works for the flow in detail.
The trade-off is governance. When customers can publish, you need rules for review, versioning and retiring dashboards nobody uses. Skipping that step turns a self-serve feature into clutter.
How Do You Keep Multi-Tenant Data Secure in Embedded Analytics?
Enforce tenant and user scoping on the server for every query, before any chart is drawn. Never rely on the dashboard front end to hide rows. Pass identity from your own authentication, apply row-level rules at the data layer, and log every access so you can prove who saw what.
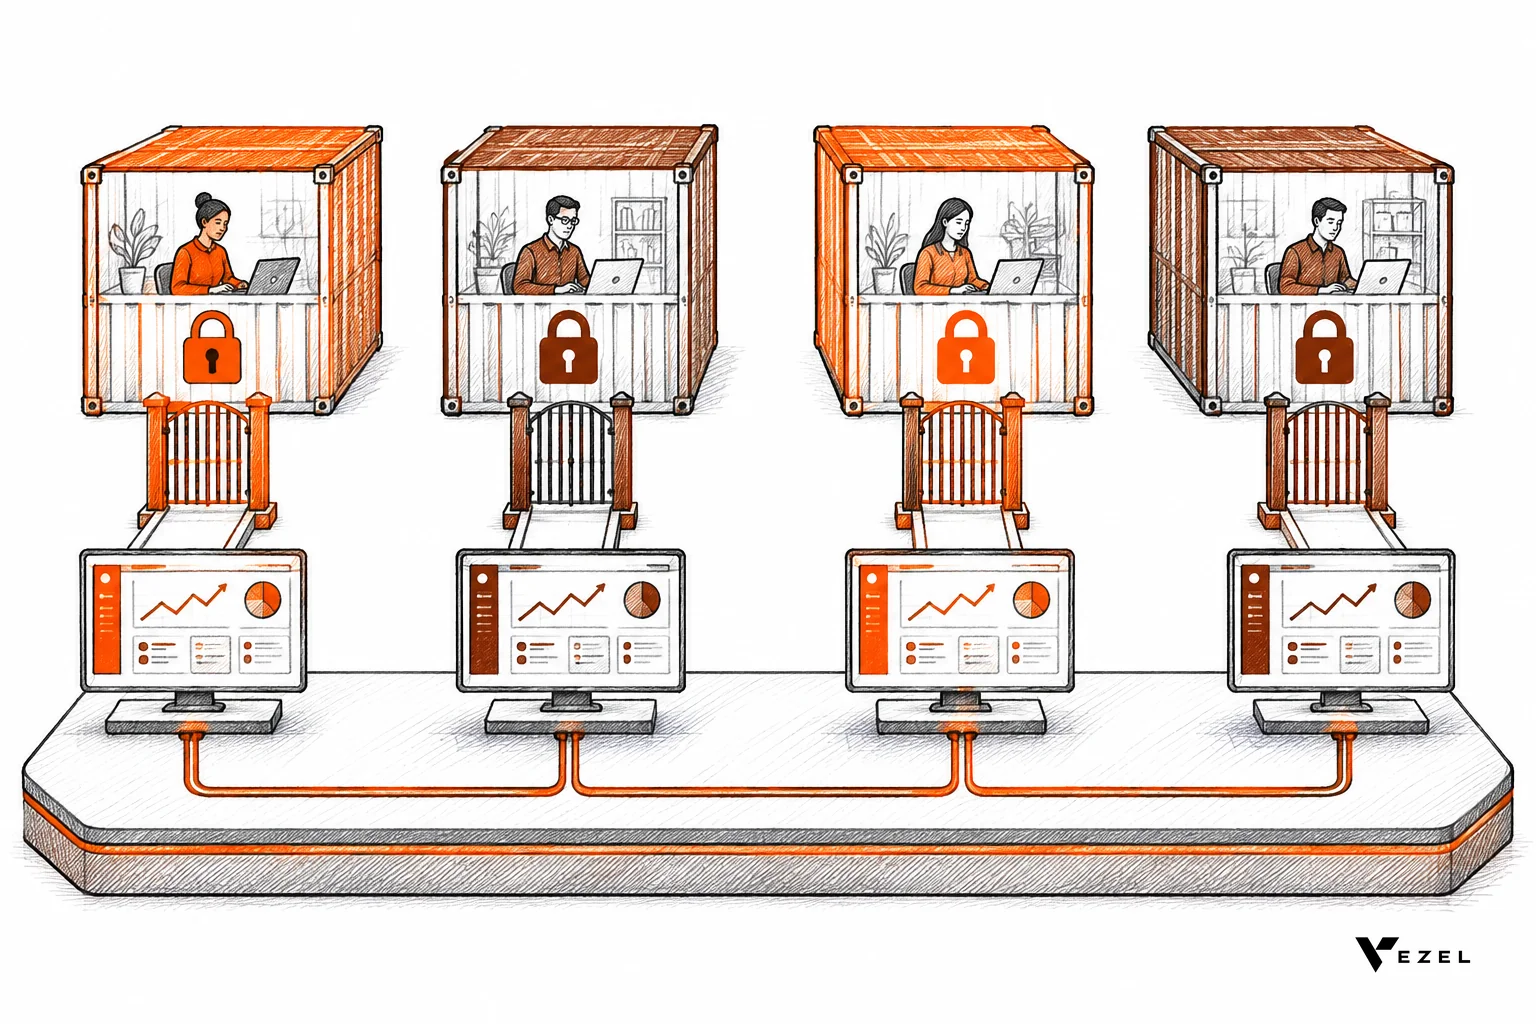
Multi-tenant analytics fails in a predictable way: a filter that works in the UI but not in the query. A user edits a request, drops the tenant filter, and sees another customer's data. Server-side scoping closes that hole.
A security checklist for any approach
- Tenant ID comes from the session, never from a parameter the browser can change.
- Row-level rules sit at the data layer, so every chart, export and API call obeys the same limits.
- One permission source. If roles live in your app and again in a BI tool, plan how they stay in sync, or avoid the duplicate.
- Short-lived tokens for iframe embeds, with scopes limited to one tenant and one user.
- Audit logs for dashboard views, exports and edits.
- Review before publish for anything customers create and share across users.
This is where inheriting beats re-implementing. Vezel extensions inherit your existing authentication, permissions and access controls, so there is no second rulebook to keep in step. If your enterprise buyers ask security questions, our post on how to choose an embedded extensibility platform covers what to verify.
What Drives the Cost of Embedded Analytics?
Cost comes from five places: the licensing model, the initial build, ongoing engineering upkeep, the data infrastructure behind the queries, and the support load from customers asking for changes. The recurring items usually outweigh the first build, so compare three-year totals, not launch day.
We are not quoting prices here, because they vary widely by vendor, contract and usage. What we can do is show where the money moves for each approach.
- Licensing: iframe tools often charge per user, per embed or by usage. A growing customer base can make that line item climb faster than your revenue per account.
- Engineering: native builds shift cost to salaries. The work never fully ends, because each new request needs a developer.
- Data infrastructure: live dashboards query your database. Heavy queries may call for a replica, a warehouse or caching, whichever approach you choose.
- Support and requests: if customers can only change dashboards through you, every change is a ticket. Self-built dashboards move that cost to the customer.
- Governance: publishing review, versioning and cleanup need an owner, especially once customers create content.
One more cost is easy to miss: opportunity. Engineers building the ninth variant of a chart are not building your core product. For a longer treatment, see our walkthrough on how to build custom dashboards inside your SaaS.
How Do You Choose the Right Approach?
Match the approach to who needs to change the dashboards and how often. If your team authors everything and customers rarely ask for changes, an iframe embed or native build is enough. If every customer wants different views, add customer self-built dashboards for that long tail.
Here are decision rules we would use:
- Unsure customers want analytics? Start with an iframe embed and measure usage for a quarter.
- Five or six reports drive most usage? Build those natively so they feel like your product.
- Requests differ account by account? Give customers a builder instead of taking each request yourself.
- Selling to regulated or security-conscious buyers? Favor options that reuse your permission model over ones that duplicate it.
- Tight on engineering time? Avoid pure native until you know which reports deserve it.
A hypothetical example: a field-service platform ships three standard native dashboards for technician utilization, job status and revenue. Large accounts then want their own regional scorecards and approval-aging views. Rather than queue those for engineering, the platform lets account admins describe them in plain English. Standard stays fast and polished; the long tail stops being your problem.
Our own view is that pure iframe embedding is a stepping stone, not a destination. Once customers ask for edits you cannot support, the seam becomes the product. What remains unsettled is how much freedom customers should have by default. Some teams limit builders to admins first, then widen access. We lean that way, but the right pace depends on your buyers.
If your own product has an operations or CRM focus, the same pattern shows up in industry-specific reporting needs we discuss with teams.
Embedded Analytics Rollout Checklist
Use this list before any approach goes live, whether you embed, build natively or hand customers a builder.
- Name the three to five questions customers ask of their data most often.
- Decide who may create, edit and share dashboards, by role.
- Confirm tenant scoping is enforced on the server, then test it by trying to break it.
- Match dashboards to your brand so they do not look like a separate tool.
- Set a review and retirement process for customer-published content.
- Track usage per dashboard so you know what to promote into the standard set.
Embedded Analytics FAQ
Is embedded analytics the same as embedded BI?
They overlap heavily. Embedded BI usually means placing a business intelligence tool's dashboards inside your application. Embedded analytics is the broader idea, covering any in-product charts, reports and insights, whether they come from a BI tool, your own SDK components or dashboards customers create themselves.
Should a SaaS company build or buy embedded analytics?
Buy or embed the common parts and build only what differentiates your product. Standard charting rarely differentiates a SaaS company. Customer-specific views are a different case: building each one yourself does not scale, so a builder customers use directly is often the better answer.
How long does it take to add embedded analytics?
An iframe embed can be live fastest, native SDK work takes longest, and timing depends on your data and team. For customer self-built dashboards, Vezel states that most SaaS platforms can integrate it in a few days, since it connects to your existing APIs.
Can customers build their own dashboards safely?
Yes, if the builder inherits your authentication and permissions, so generated dashboards can only reach data the user could already access. Add publishing review and lifecycle rules on top. Without those controls, self-serve creation can create sprawl and risk.
Where to Go Next
Embedded analytics works best when you stop treating it as one dashboard project and start treating it as a spectrum: standard views you control, plus a way for each customer to build theirs. If you want to see customer-built dashboards running inside a host product, with your permissions carried through, book a demo with Vezel and bring one real reporting request from your own customers. We respond within 1-2 business days.
Prefer more reading first? Our guide to evaluating platforms is above, and the practical guide to live reporting rounds it out.