


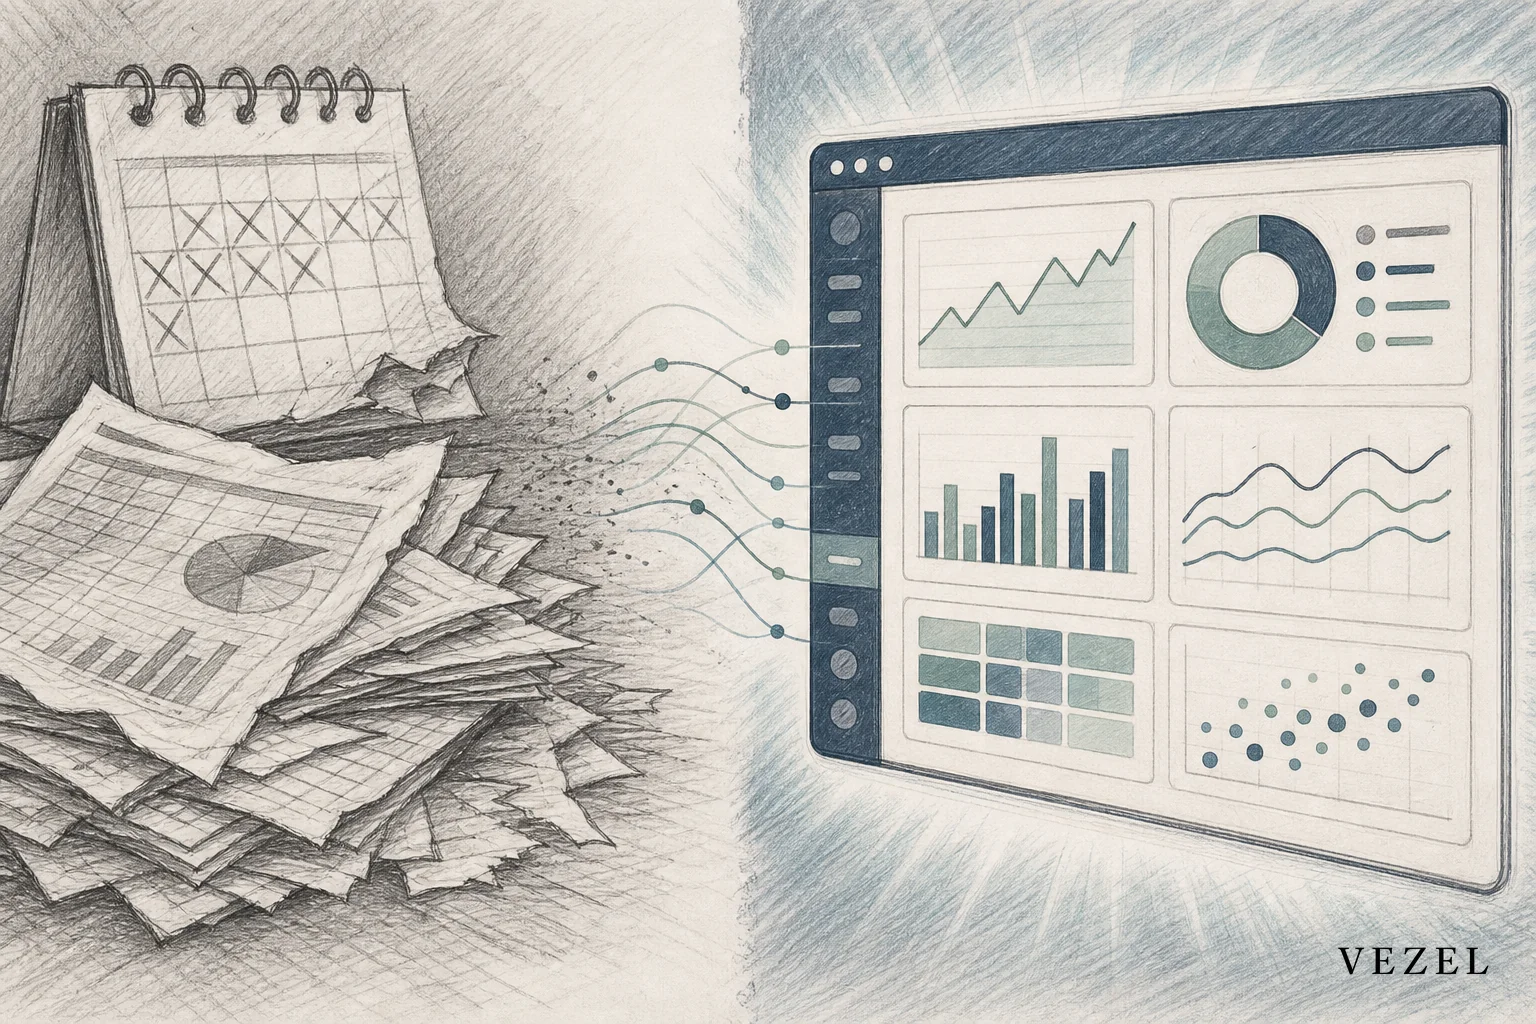
You replace static BI exports with live embedded dashboards by running API auto-discovery against your existing data model, mapping old report fields to live objects, and letting customers build their own views in plain English instead of waiting on a scheduled CSV. No custom pipeline required, no separate login, and the data is never more than a few seconds old.
Key Takeaways
- Auto-discovery skips the pipeline: OpenAPI-based discovery maps your existing endpoints and objects automatically, so there's no ETL job to build or maintain.
- Permissions travel with the data: RBAC and row-level access inherit from your platform's existing authentication instead of getting rebuilt per customer.
- Self-serve beats the ticket queue: Customers who ask for "one more report" can build it themselves in plain English, cutting the support and engineering load tied to custom reporting requests.
- Migration works in phases: Pilot with one enterprise account, prove adoption, then retire the scheduled export job for that segment.
- Exports don't disappear overnight: Keep CSV export available as a fallback while the live dashboard becomes the default.
At a Glance: Static Exports vs Live Embedded Dashboards
| Attribute | Static BI Export | Live Embedded Dashboard |
|---|---|---|
| Data freshness | As of last scheduled run (often 24 hours old) | Live, queried at request time |
| Setup method | Custom pipeline or scheduled job | API auto-discovery against existing endpoints |
| Permission model | Manually replicated per export | Inherited from host platform's RBAC |
| Who builds new views | Engineering or BI team, on request | Customer, self-serve, in plain English |
| Maintenance burden | Grows with every customer variant | Centralized, versioned in a marketplace |
| Typical delivery time | Days to weeks per report | Minutes per dashboard |
1. Audit Where Static Exports Are Actually Costing You
Start by counting the scheduled CSV jobs your support and CS teams field questions about every week. Most SaaS teams underestimate this number until they actually look.
Look for the tell-tale complaints: "this number doesn't match what I see in the app," "can you re-run this export," or "why is yesterday's data missing." Each of those is a support ticket that a live dashboard would have prevented.
Spreadsheet reconciliation is another signal. If your customer success team spends time explaining why an export doesn't match the live app, that gap is the exact problem live embedded dashboards close.
2. Run API Auto-Discovery Against Your Existing Data Model
Once you know which exports to target, the next step is connecting a dashboard to the same data those exports pull from, without writing new integration code.
API auto-discovery reads your existing OpenAPI spec and maps it to your product's data objects automatically. Instead of an engineer manually wiring a new data source, the discovery layer finds the endpoints, understands the relationships between objects, and makes them available to build against.
Why Doesn't This Require a Custom Data Pipeline?
It doesn't require a pipeline because the dashboard queries your live API directly instead of copying data into a separate warehouse. There's no ETL job to schedule, no sync to monitor, and no second source of truth to keep consistent with the product.
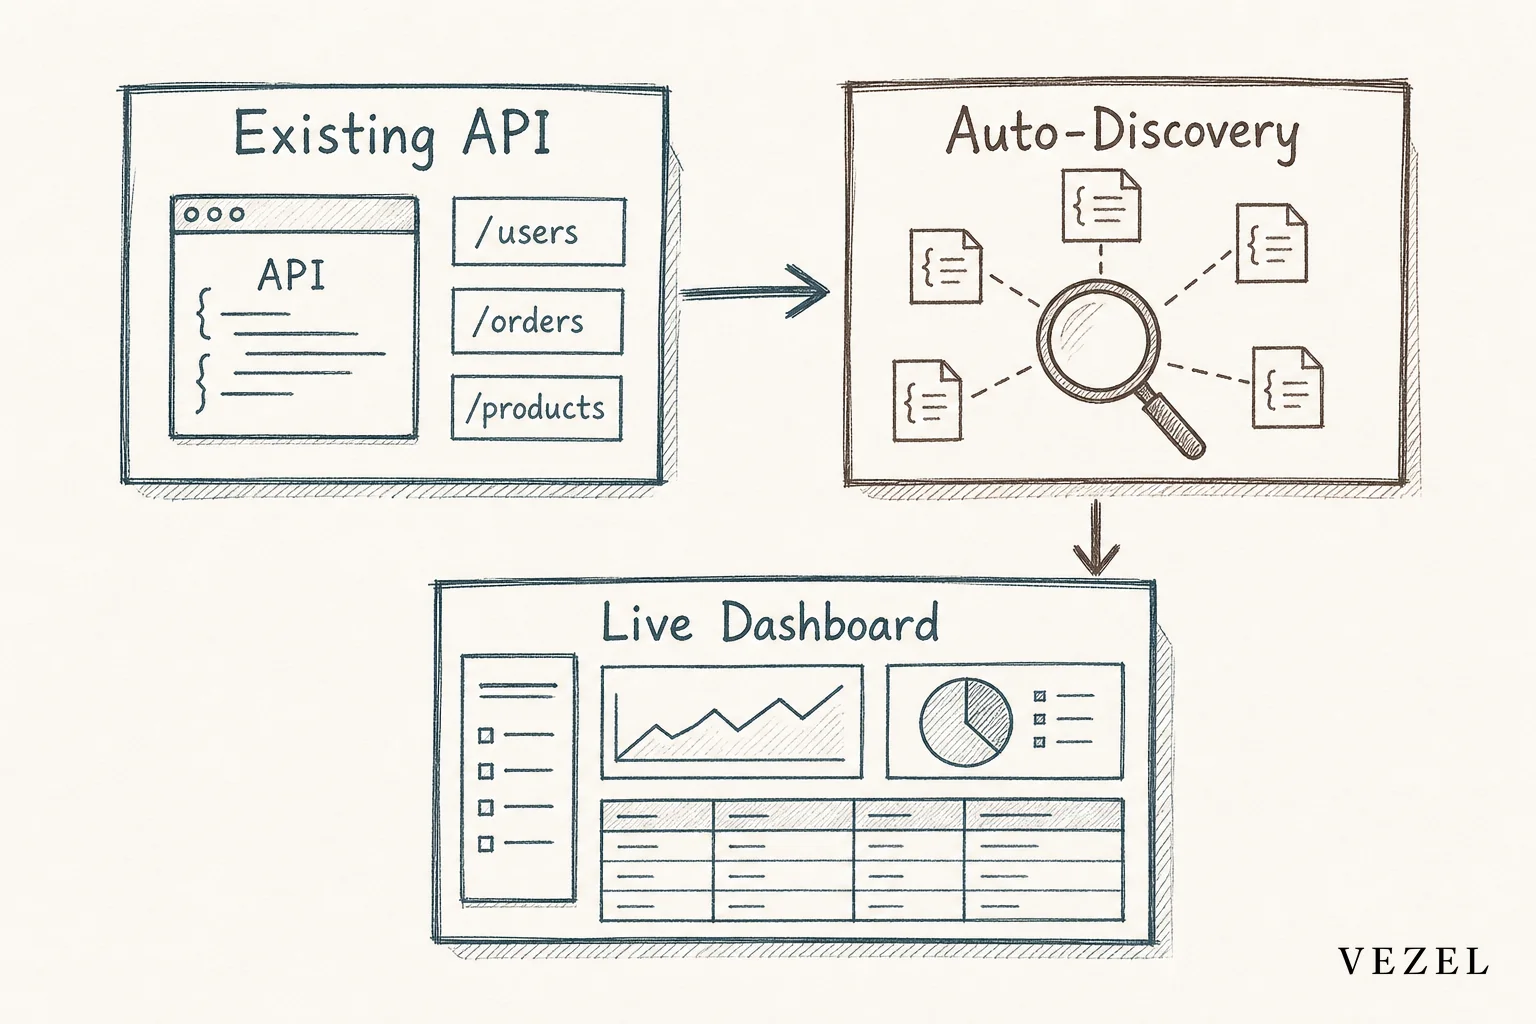
This is the step that made building custom dashboards inside a SaaS product practical at scale. Before auto-discovery, every new dashboard meant a developer writing bespoke query logic against your API. Now the mapping is done automatically, and what used to take a sprint takes an afternoon.
3. Map Static Report Fields to Live Objects
Your existing CSV exports already encode business logic your customers trust: how "active customer" is defined, how revenue gets categorized, which date field counts as "close date." Don't throw that away.
Translate each column in the old export into a field on a live object surfaced by auto-discovery. Where the old export applied a filter or calculation, replicate that same logic in the dashboard so the numbers match on day one. A mismatch here is the fastest way to lose customer trust in the new system.
4. Inherit Permissions Instead of Rebuilding Them
Static exports usually get built once and shared broadly, which means the permission boundaries that exist inside your live product often get lost the moment data lands in a spreadsheet. A live embedded dashboard should not repeat that mistake.
The dashboard should execute every query using the requesting user's own role and row-level access, the same authentication your product already enforces. That means a regional manager sees only their region's data, and a finance admin sees what the finance role allows, without a second permission system to maintain. This is the same principle covered in how embedded workflow builders inherit access controls for approval processes.
5. Let Customers Build Dashboards in Plain English
Once auto-discovery and permission inheritance are in place, the biggest win is handing dashboard creation to the customer instead of routing it through your backlog.
A customer types a request like "show me overdue invoices by region this quarter," and a working dashboard is generated from live data in minutes. No ticket, no developer, no wait for the next sprint.

This directly addresses the pattern behind reducing engineering backlog from enterprise requests: every custom report that used to require a developer now gets built by the person who actually needs it.
6. Roll Out Gradually and Retire Exports on a Schedule
Don't cut over every customer at once. Pick one enterprise account with a heavy export dependency and migrate their most-used reports first.
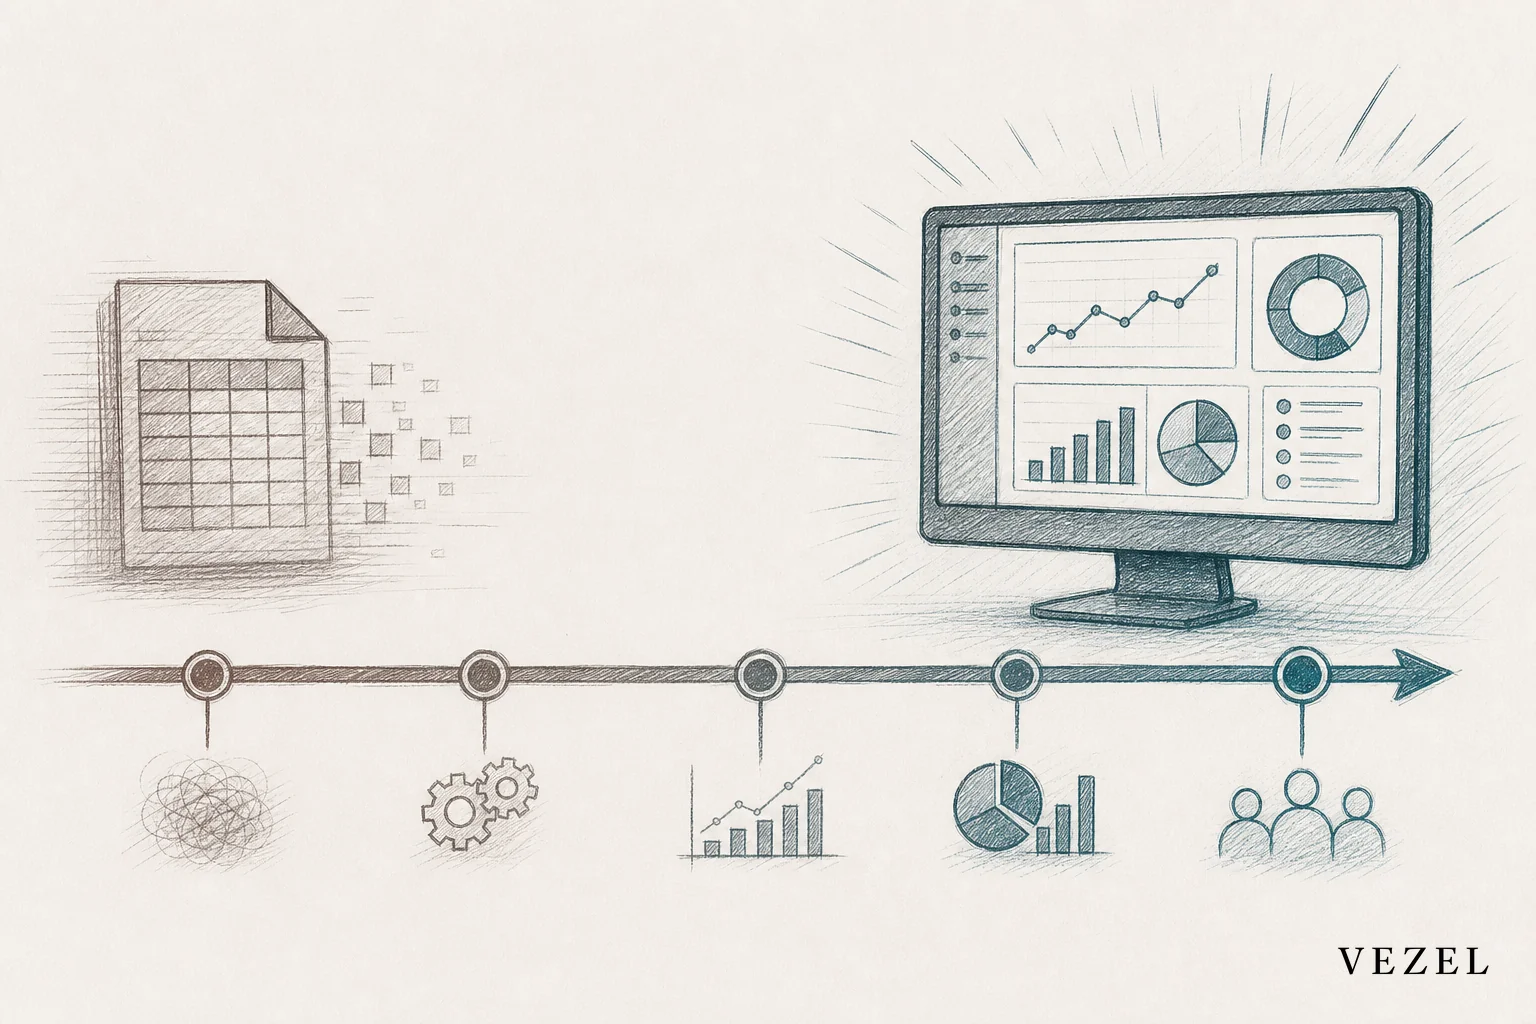
Watch adoption for two to four weeks. If usage of the live dashboard climbs and export requests drop, that's your signal to retire the scheduled job for that account. Repeat account by account rather than forcing a company-wide switch.
What Happens to Customers Who Still Want CSV Exports?
Keep CSV export available as a fallback option, not the default path. Some finance and compliance teams need a point-in-time snapshot for audit purposes, and that's a legitimate use case separate from day-to-day reporting.
Common Pitfalls When Migrating Off Static Exports
- Skipping permission mapping: Launching a dashboard before RBAC is verified risks exposing data across accounts or roles.
- Ignoring white-labeling: A dashboard that looks bolted-on erodes the trust you're trying to build with the migration.
- Underestimating latency expectations: Some customers assume "live" means instant; set clear expectations about query performance on large datasets.
- Migrating everyone at once: A single rocky rollout can sour an entire account base on the new approach.
Teams weighing this transition against a general-purpose no-code tool should also look at how Glide compares to embedded extensibility built specifically for SaaS products — general app builders don't inherit your permission model the way a purpose-built embedded layer does.
FAQ
What is a live embedded dashboard?
A live embedded dashboard is a report built inside your existing SaaS product that queries live data through your API in real time, instead of pulling from a scheduled export or separate BI tool.
How long does migration take?
A single account's core reports can typically move from static export to live dashboard within a few weeks once API auto-discovery is connected, since no custom pipeline needs to be built per report.
Does this replace our BI tool entirely?
Not necessarily. Many teams keep a dedicated BI tool for deep cross-account analytics while moving customer-facing, account-specific reporting into live embedded dashboards inside the product itself.
Static exports were never the goal, they were the workaround your customers built because the product couldn't give them live answers. If your team wants to see how API auto-discovery, permission inheritance, and plain-English dashboard building work together inside your own product, book a demo or see how it works. If you're still scoping the migration and want to talk through your specific API setup first, talk to an expert before you commit engineering time to another custom pipeline.