

Why do enterprise customers keep asking for custom dashboards?
Enterprise customers ask for custom dashboards because a standard report view is built for the average account, while their teams run specific workflows, roles and decision thresholds. A procurement lead, a renewal manager and a compliance officer need different metrics from the same data, and one fixed screen cannot serve all three.
If you run product or engineering at a B2B SaaS company in the United States or any other English-speaking market, you have seen the ticket: "Can we get a dashboard that shows X, filtered by Y, for our ops team?" It looks like a feature request. It is really a signal about how that buyer works.
At Vezel, we build an AI extension layer that lets teams create dashboards, reports and workflows inside an existing SaaS product from plain English. This piece covers why the requests keep coming, what they tell you, what answering each one by hand costs, and a way to respond without a one-off build every time.
The standard reporting view breaks down in three places
A standard view is a bet that most customers want the same cut of the data. That bet holds for small accounts. It fails when a large customer has many roles, many sites or its own definitions of "good".
One view, many roles
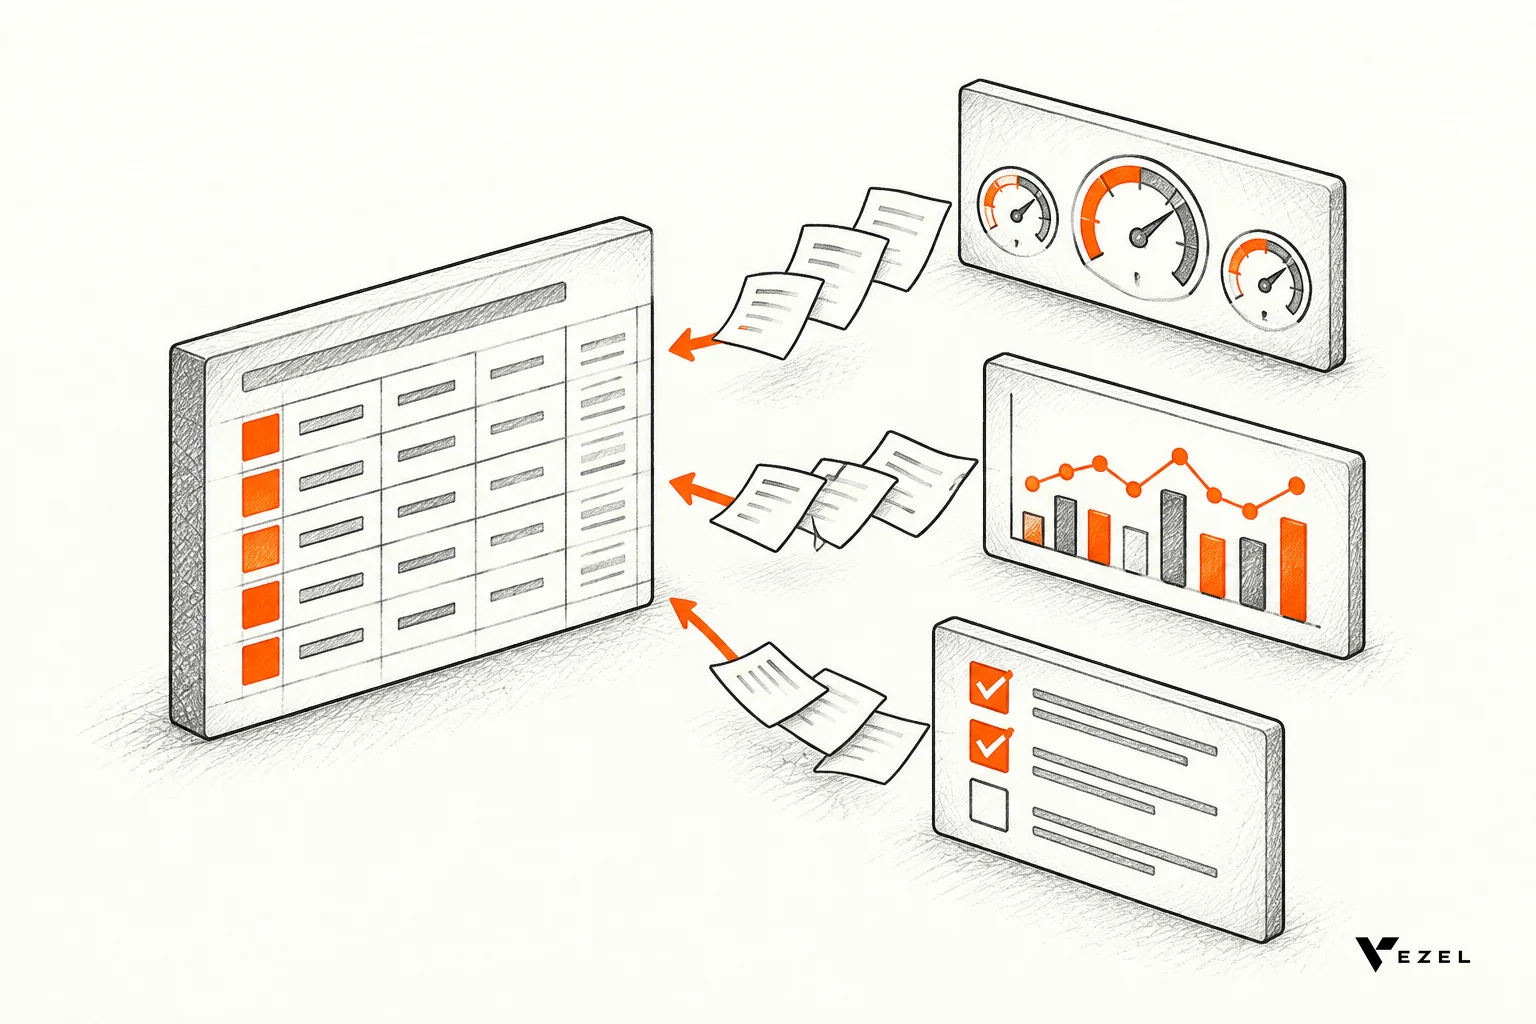
A research review of tailored performance dashboards notes that dashboards are used by people in different positions with different goals, so each user needs a different set of metrics. Enterprise accounts have more of those positions. Each one wants its own screen.
Reports nobody opens
Standard reports also age badly. In a 2011 piece, MIT Sloan Management Review reported that companies examining how information is consumed routinely find more than half of all standard reports are no longer used by anyone. Shipping more fixed reports does not fix the gap.
The export button is not the answer
Many products respond with a CSV export. That delivers data and leaves the actual request unsolved. The customer still rebuilds the view in a spreadsheet, and the work leaves your product.
The UNU Campus Computing Centre describes the same loop in HR analytics: when the required view is not already in a dashboard, it becomes a report request, and someone must write a query, prepare the analysis and validate the result. Enterprise buyers know that loop well. They would rather shape the view themselves.
This is also why searches like "native embedded analytics vs iframe dashboards" and "embed dashboards in SaaS" keep appearing. Buyers want a dashboard that behaves like part of the product, with your permissions and your look, not a separate tool in a frame. Our guide to white label dashboards covers the branding side.
Custom dashboard requests are free research on buyer operations
Each request names a decision the customer makes, the data behind it and the people involved. Read as a pattern, requests show you where your product stops and the customer's real process begins. That is better evidence than most survey results.
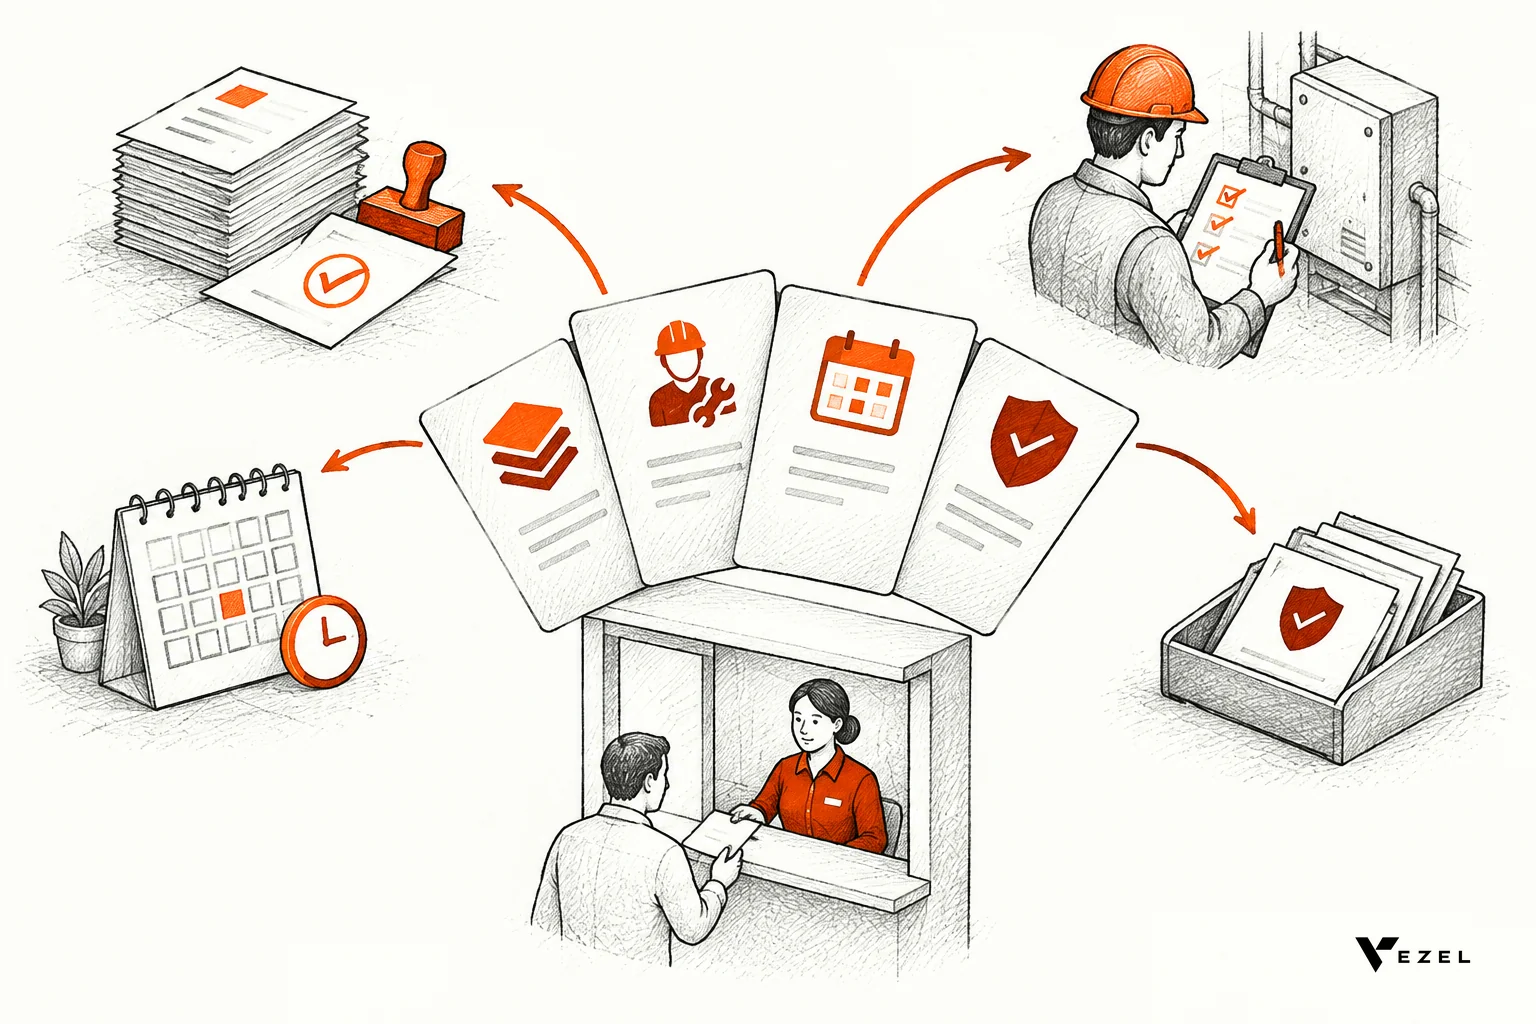
The table below maps common request types to what they usually signal. The examples reflect the kinds of dashboards our customers' teams build with Vezel across CRM, ERP, field service and HR products.
| What the customer asks for | What it signals about their operations | Typical product area |
|---|---|---|
| Customer health dashboard or renewal workspace | Account managers run a renewal process your product does not model | CRM and customer success |
| Executive sales review or territory planning view | Leadership reviews on a fixed cadence with their own definitions | CRM |
| Supplier scorecard or procurement approval view | Buying decisions follow internal approval rules and thresholds | ERP and operations |
| Inventory or production monitoring dashboard | Floor teams need live status, not a weekly report | ERP and manufacturing |
| Technician scorecard or equipment performance view | Field teams are measured on metrics the product does not track | Field service |
| Onboarding, review or compliance status board | Approvals and audits must be provable before an inspection | HR and compliance |
Look at the second column. Almost none of these are "missing charts". They are missing workflow steps, approvals and definitions. A dashboard is just the first place the gap shows up.
That matters for how you triage. A request repeated by five accounts points to a shared need. A request that mentions one internal approval chain points to one customer's process. Treating both the same way is how roadmaps bloat.
What do one-off dashboard builds cost your engineering team?
One-off dashboard builds cost engineering capacity first, then ongoing maintenance. Each build is code someone must test, support and upgrade, often for a single account. Over time they add special cases to the core product, slow the roadmap and leave no clear path to retire what a customer stopped using.
The build ticket is the small part. The larger bill arrives later:
- Maintenance: every upgrade to your data model must be checked against every custom view.
- Roadmap bloat: settings, flags and exceptions pile up in the core, and the whole team slows down.
- Stalled core work: shared features, security and reliability wait while engineers finish a customer's report.
- No exit: nobody owns retirement, so dashboards live on after the need is gone.
Saying no has a price too. Prospects stall when one missing report blocks a deal, and sales ends up making roadmap promises. Existing customers fall back on spreadsheets and disconnected tools, which pulls daily work out of your platform and raises renewal risk.
For a deeper look at the numbers, see our comparison of an extensibility platform and custom development. For the structural problem, read why roadmap bloat from enterprise customers keeps getting worse.
How can product teams respond without a one-off build each time?
Product teams can respond by delivering the dashboard as an in-product extension instead of a core feature. The customer describes the dashboard in plain English, it runs inside the product under existing permissions, and usage data later shows whether to keep it customer-specific, share it with other accounts, or promote it into the core.
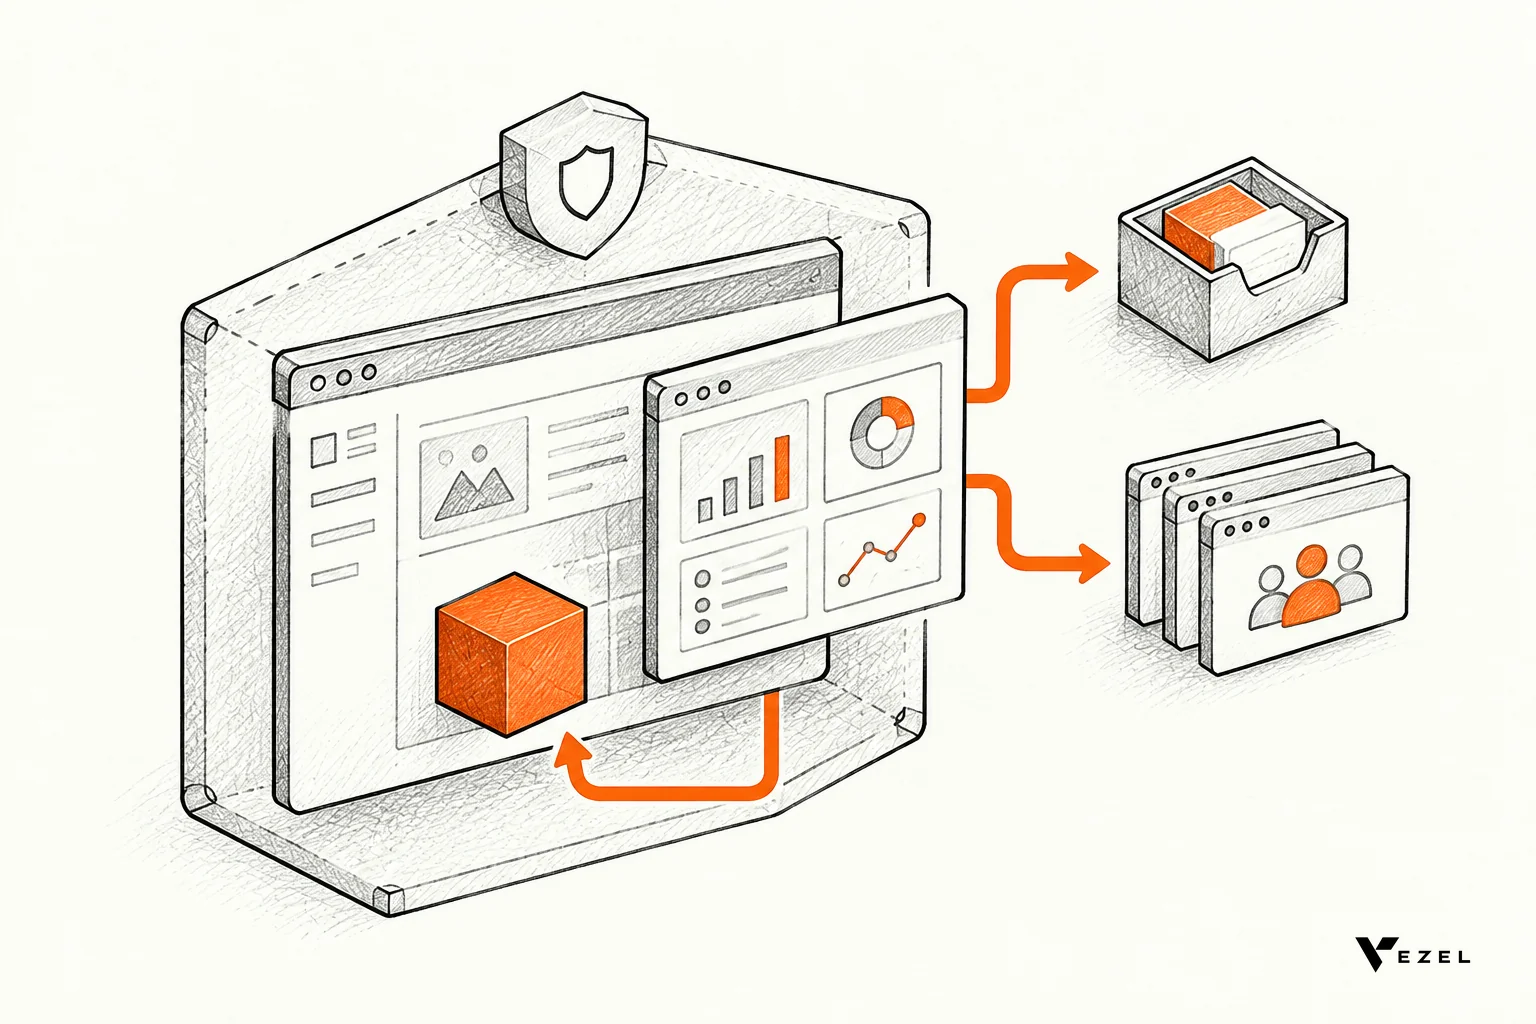
The idea behind this is simple. Separate creating a capability from the decision to maintain it forever in your shared product. Useful does not mean core.
Build, learn, evolve
We use a three-step loop. Build the dashboard as an extension, in context, from the customer's own words. Learn who uses it, how often and what feedback comes back. Evolve it based on that evidence.
| What usage shows | What to do |
|---|---|
| One team uses it daily, nobody else cares | Keep it as a customer-specific extension |
| Several similar accounts ask for or adopt it | Refine it and share it with more customers |
| Broad, repeated use across the base | Consider promoting it into the core product |
| Little use after launch | Retire it; no core investment was spent |
Usage informs the decision; it does not replace product judgment. Not every popular extension should become a core feature.
What stays under your control
Extensions are built to use your product's APIs, data models, authentication and permissions, so they inherit your existing access controls. They are white-labeled and follow your design system, so they feel native. Publishing, permissions, approvals and the extension lifecycle are managed from a central control plane.
On timing, most SaaS platforms can integrate Vezel in a few days. Setting up the control plane review queue usually takes 7 days. Depth of integration depends on the interfaces your product exposes, and Vezel cannot reach data your product does not make available.
If you want the build steps, our walkthrough on building custom dashboards inside your SaaS goes through them in order.
A practical triage for the next dashboard request
Before anyone opens a ticket, ask five questions. They take ten minutes and sort most requests.
- Which decision does this dashboard support? If the customer cannot name one, the request is probably a symptom of something else.
- Which role uses it? Define who sees what, and check it against existing permissions.
- Does the data already exist behind your APIs? If yes, an extension can read it. If not, that is a core data question.
- How many accounts have asked for something similar? Tag every request so repeats become visible.
- Is there a workflow behind the screen? If an approval or a form sits behind it, scope that too, not only the charts.
Then route it. Narrow, customer-specific needs become extensions. Broad needs backed by evidence go on the roadmap. Anything with a missing data source or a security question goes to engineering first.
We suggest starting with a pilot on one high-value use case, then measuring time to delivery, adoption and impact against your current process. The business case for extensibility is a set of potential outcomes, not guaranteed results, so validate it with your own baselines.
When a prospect shares a demo account, we create a working proof of what is possible inside their SaaS. If you want to see that on your own product, book a demo and bring your most-requested dashboard. We respond within 1 to 2 business days. If you would rather see the mechanism first, see how it works from API connection to governed extension.