

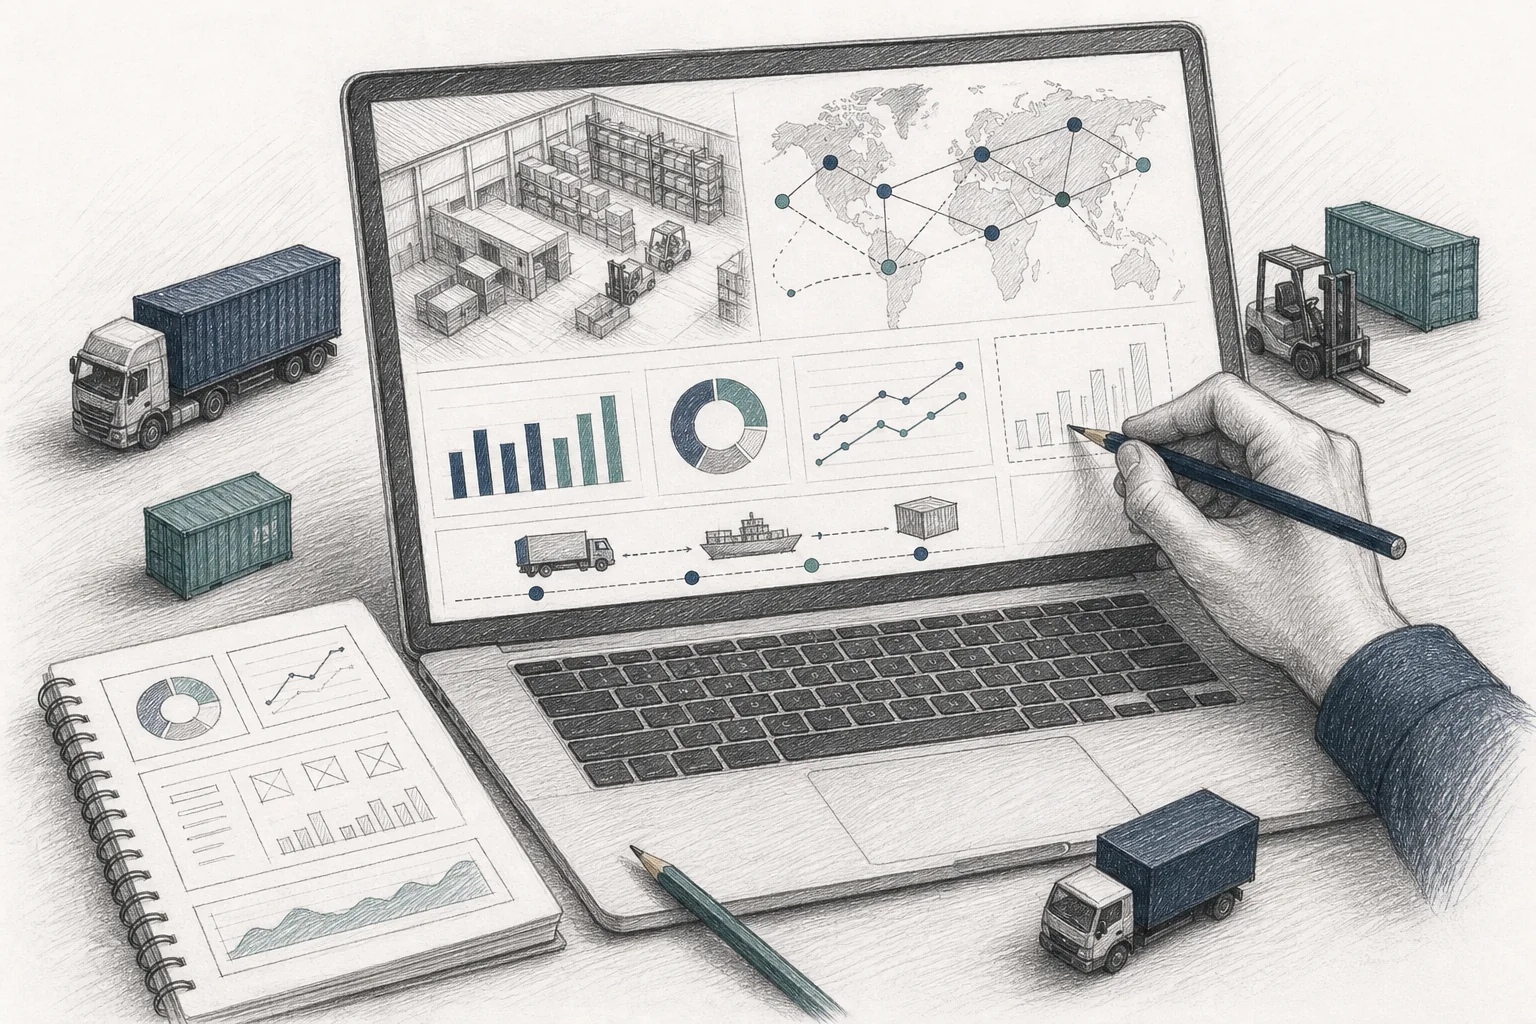
A regional account manager at a mid-market freight visibility platform gets a message from her biggest customer three weeks before a renewal decision. The customer is a national grocery distributor running thousands of loads a week. Their VP of logistics wants one thing before signing another year: a custom on-time-in-full scorecard, broken out by carrier and by distribution center, with a landed-cost view their finance team can pull without opening a ticket.
The account manager already knows how this goes. She'll escalate to product. Product will scope it. Engineering will say it's technically possible but not this quarter. Meanwhile the distributor's team is building the same numbers by hand in a spreadsheet, and that spreadsheet is slowly becoming the "real" system of record. This is the quiet, recurring crisis behind supply chain saas custom reporting for enterprise clients: every large account wants its own view of the truth, and no single dashboard can serve them all.
This isn't a one-off. It's a pattern that repeats across nearly every supply chain SaaS platform, from transportation management systems to warehouse and inventory platforms. Enterprise clients don't just want data. They want *their* data, sliced the way their operation actually runs. This guide walks through why that demand is so hard to satisfy with a traditional product roadmap, and how a growing number of supply chain SaaS companies are solving it by letting enterprise clients build their own reports, live, on real platform data.
1. Understand Why Supply Chain Data Resists One-Size-Fits-All Reporting
Supply chain software sells into an unusually wide range of buyers under one product umbrella. A single transportation management platform might serve a 3PL managing carrier relationships, a manufacturer tracking inbound raw materials, a retailer monitoring distribution center throughput, and a food distributor managing cold-chain compliance. Each of these customers is nominally doing "logistics," but their daily reporting needs look nothing alike.
A carrier wants a scorecard built around on-time pickup and detention time. A shipper wants landed cost broken down by lane and by SKU. A 3PL wants margin visibility across every client it manages. A cold-chain distributor wants temperature-exception reports tied to specific shipment IDs for audit purposes. Ask any of them to use the platform's default reporting module, and you'll typically get somewhere between 60% and 80% of what they need. The rest gets solved somewhere else, usually in a spreadsheet nobody on the vendor's side can see.
This mismatch is sometimes called the usage gap, and supply chain SaaS platforms feel it acutely because logistics KPIs vary so much by mode, industry, and contract structure. Industry benchmarks for B2B SaaS commonly put average feature adoption somewhere in the 22-35% range, and reporting modules are frequently among the least-used parts of a platform precisely because they're built for a hypothetical average customer who doesn't exist. If you've felt this tension already, you may find it useful background in how missing workflows quietly drive SaaS churn, since reporting gaps behave the same way.
2. Calculate the Real Cost of One-Off Custom Reports
When a supply chain SaaS company treats every enterprise reporting request as a custom engineering project, the costs stack up fast, and most of them are invisible until you look for them directly.
Start with engineering capacity. Some industry estimates suggest that as much as 30-40% of engineering time at mid-market B2B SaaS companies goes toward one-off, single-customer requests, many of which are exactly this kind of bespoke reporting build. A dwell-time dashboard built for one distributor rarely gets reused by the next one, because the next customer's contract terms, carrier mix, and KPI definitions are different. The build becomes permanent maintenance debt sitting inside the core codebase, slowing down every future release.
Then there's the backlog math. If a supply chain SaaS company has 100 enterprise accounts each filing two or three custom reporting requests a quarter, that's 200-300 requests landing on an engineering team that can realistically ship 20-30 features in the same window. No amount of prioritization discipline closes that gap. It's arithmetic, not effort. For a deeper look at why this backlog keeps growing even with a well-run team, see how to reduce SaaS engineering backlog from enterprise requests.
The most expensive cost, though, is the one that shows up at renewal. When a report doesn't get built, the enterprise client doesn't just wait patiently. They build the report themselves, usually in a spreadsheet or a BI tool connected through a fragile export, and that workaround slowly becomes their real operational tool. The platform still gets logged into, but it stops being where the real decisions happen. That's the churn pattern that customer success teams describe as "the account went quiet, then it went dark."
3. Compare the Standard Fixes and Why They Fall Short
Most supply chain SaaS teams try a few standard responses before realizing none of them close the gap for good.
- Canned reports and configuration panels. Pre-built reports with a few filter toggles work fine when customer variance is narrow. They break down the moment a customer's KPI logic diverges from what the report was designed around, because configuration changes how an existing report behaves, it can't create a report that doesn't exist yet.
- Exporting to Tableau or Power BI. This looks like a solution, but it quietly creates a second system of record. Data has to be piped out, permissions have to be re-implemented outside the platform, and the enterprise client's "real" reporting now lives somewhere the SaaS vendor doesn't control or see.
- Bespoke engineering for whale accounts. Assigning engineers to build custom dashboards for your biggest logistics clients works for a handful of strategic accounts. Past that, it creates roadmap hijacking, where the loudest renewal of the quarter decides what gets built next, at the expense of the product every other customer relies on.
- Internal tool builders like Retool. These dramatically speed up internal dashboard-building, but they live outside the host product, with a separate login and their own environment. Enterprise clients don't want to leave the platform they already trust to view their own shipment data somewhere else, and these tools don't inherit the platform's row-level permissions by default.
Each of these approaches solves a slice of the problem and creates a new one. If you're actively weighing build-it-yourself internal tools against something purpose-built, Retool vs embedded extensibility for SaaS products covers that trade-off in more detail.
4. Build Embedded, Self-Serve Reporting Enterprise Clients Can Configure Themselves
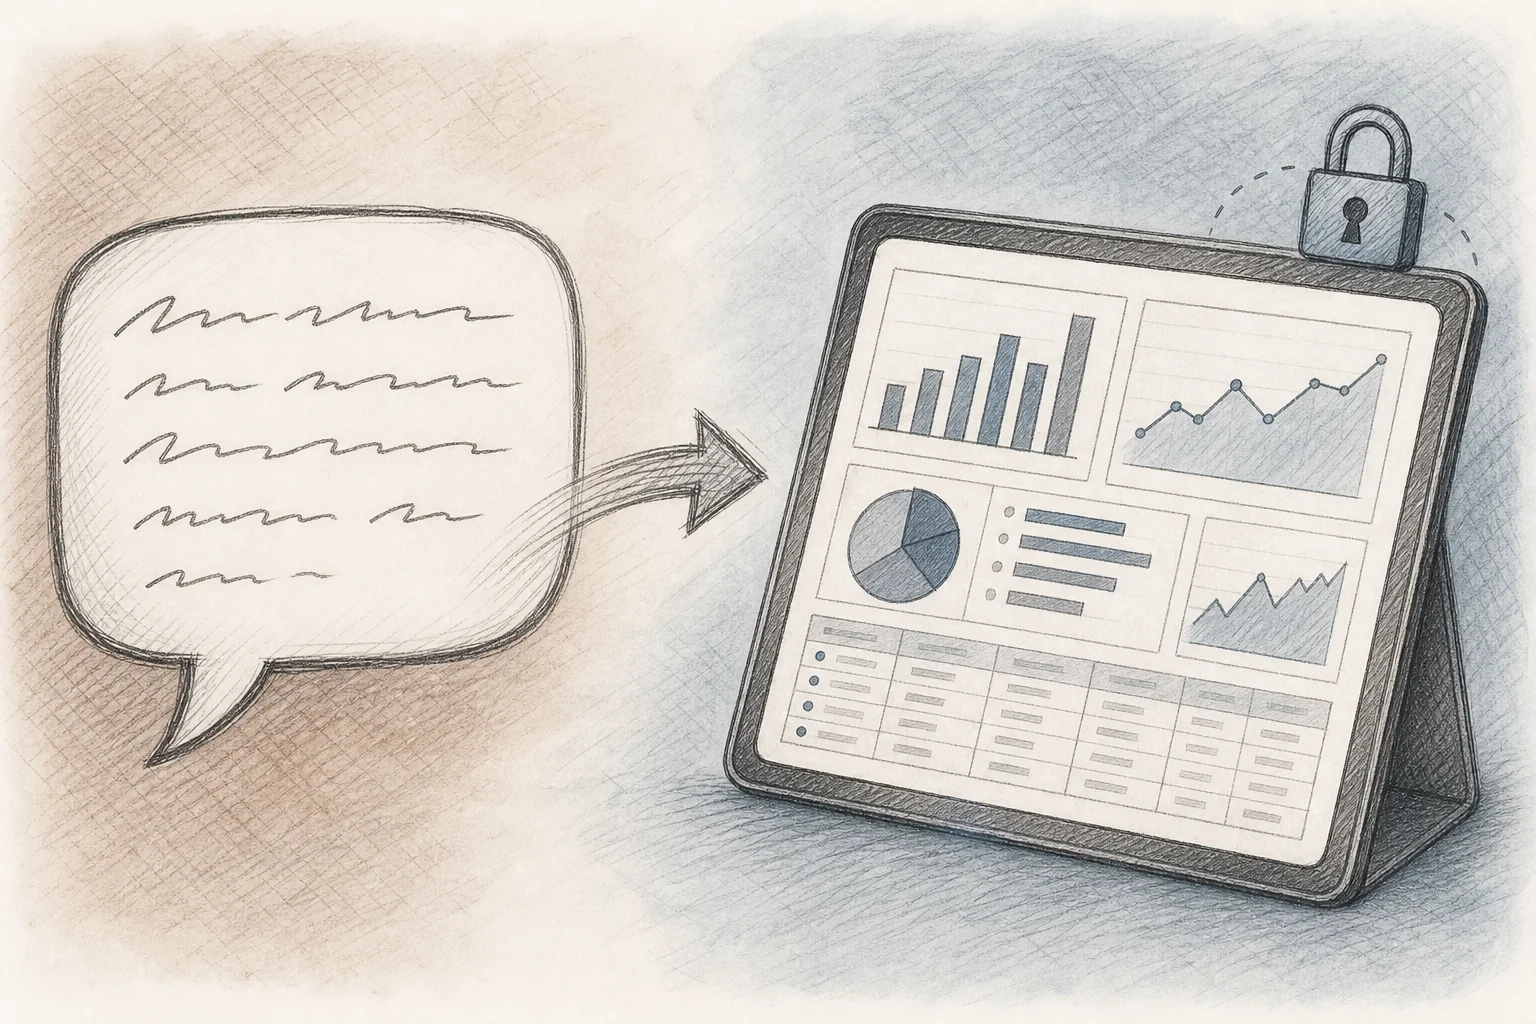
The fix that's actually holding up at scale looks different from any of the above. Instead of routing every reporting request through engineering, a growing number of supply chain SaaS platforms are embedding an AI extension layer directly inside the product, one that lets an enterprise client's own ops or analytics team describe the report they want in plain English and get a working dashboard back the same day.
Picture the grocery distributor from the opening scenario. Instead of filing a ticket and waiting on a roadmap slot, their ops lead types something like: "Show me on-time-in-full by carrier and distribution center for the last 90 days, with a red flag on anything under 92%." The system maps that request to the platform's existing shipment and carrier data, generates a focused dashboard, and deploys it that same session, connected to real, live data rather than a static export.
Three things make this fundamentally different from a chatbot answering a question or a spreadsheet export:
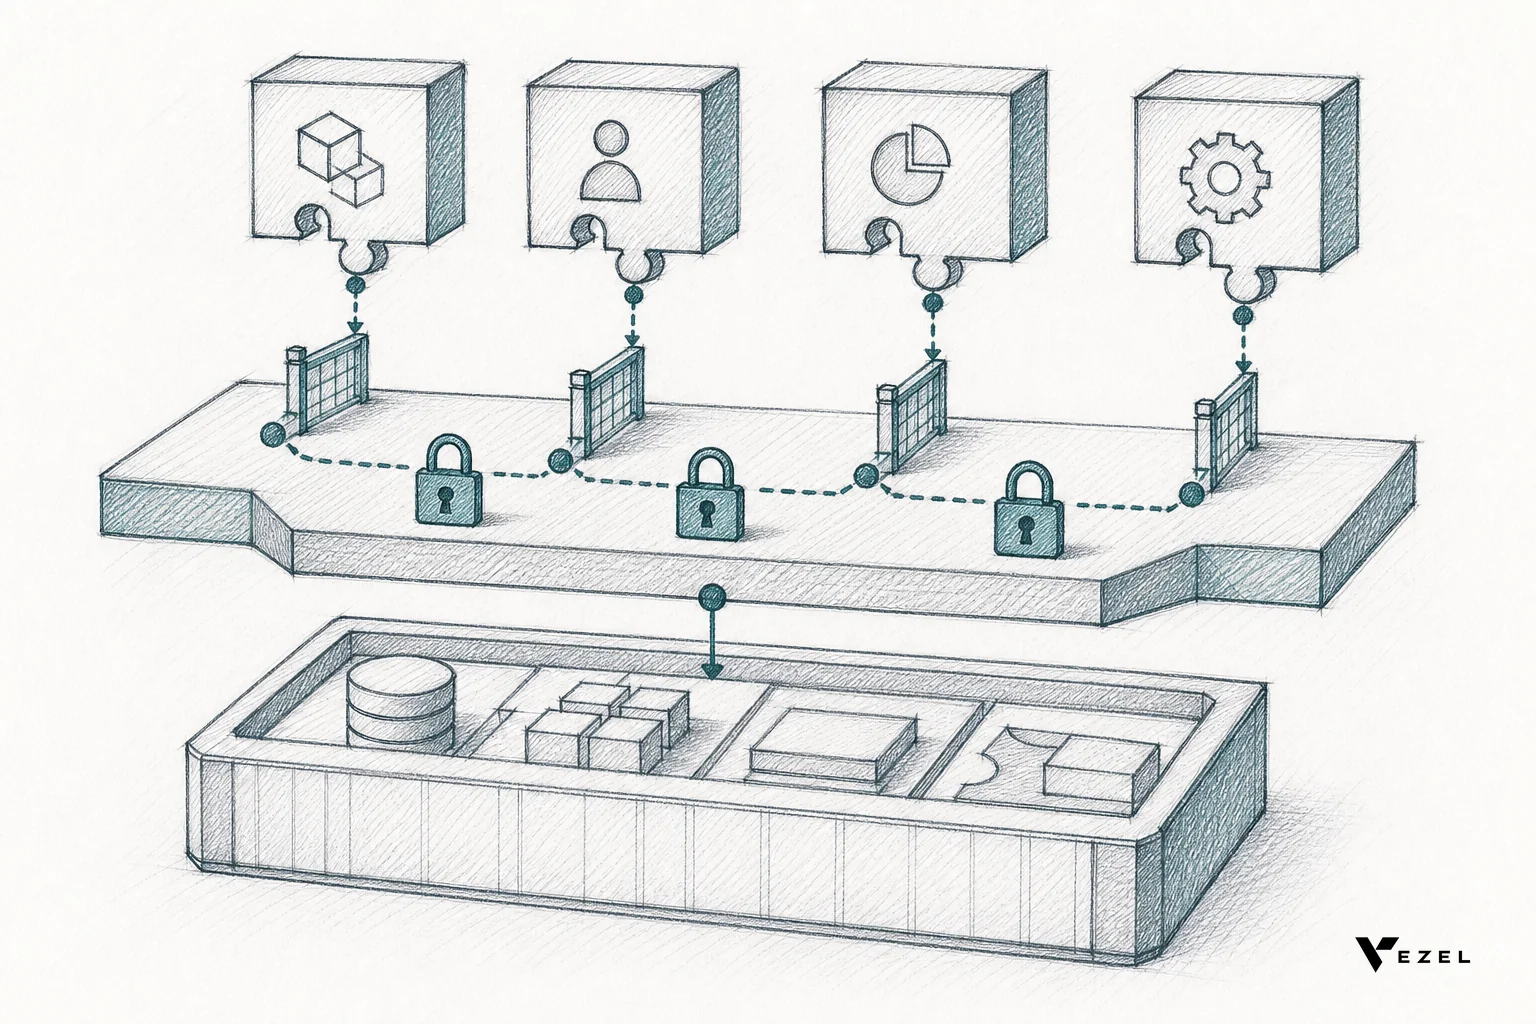
- It inherits the platform's security model. If a dock supervisor can only see their own distribution center's shipments in the core product, the report they build respects that same restriction automatically. Nothing is exposed that wasn't already visible to that role.
- It's white-labeled. The generated dashboard adopts the host platform's colors, typography, and navigation, so it feels like a native part of the product the enterprise client already trusts, not a bolted-on tool with its own login screen.
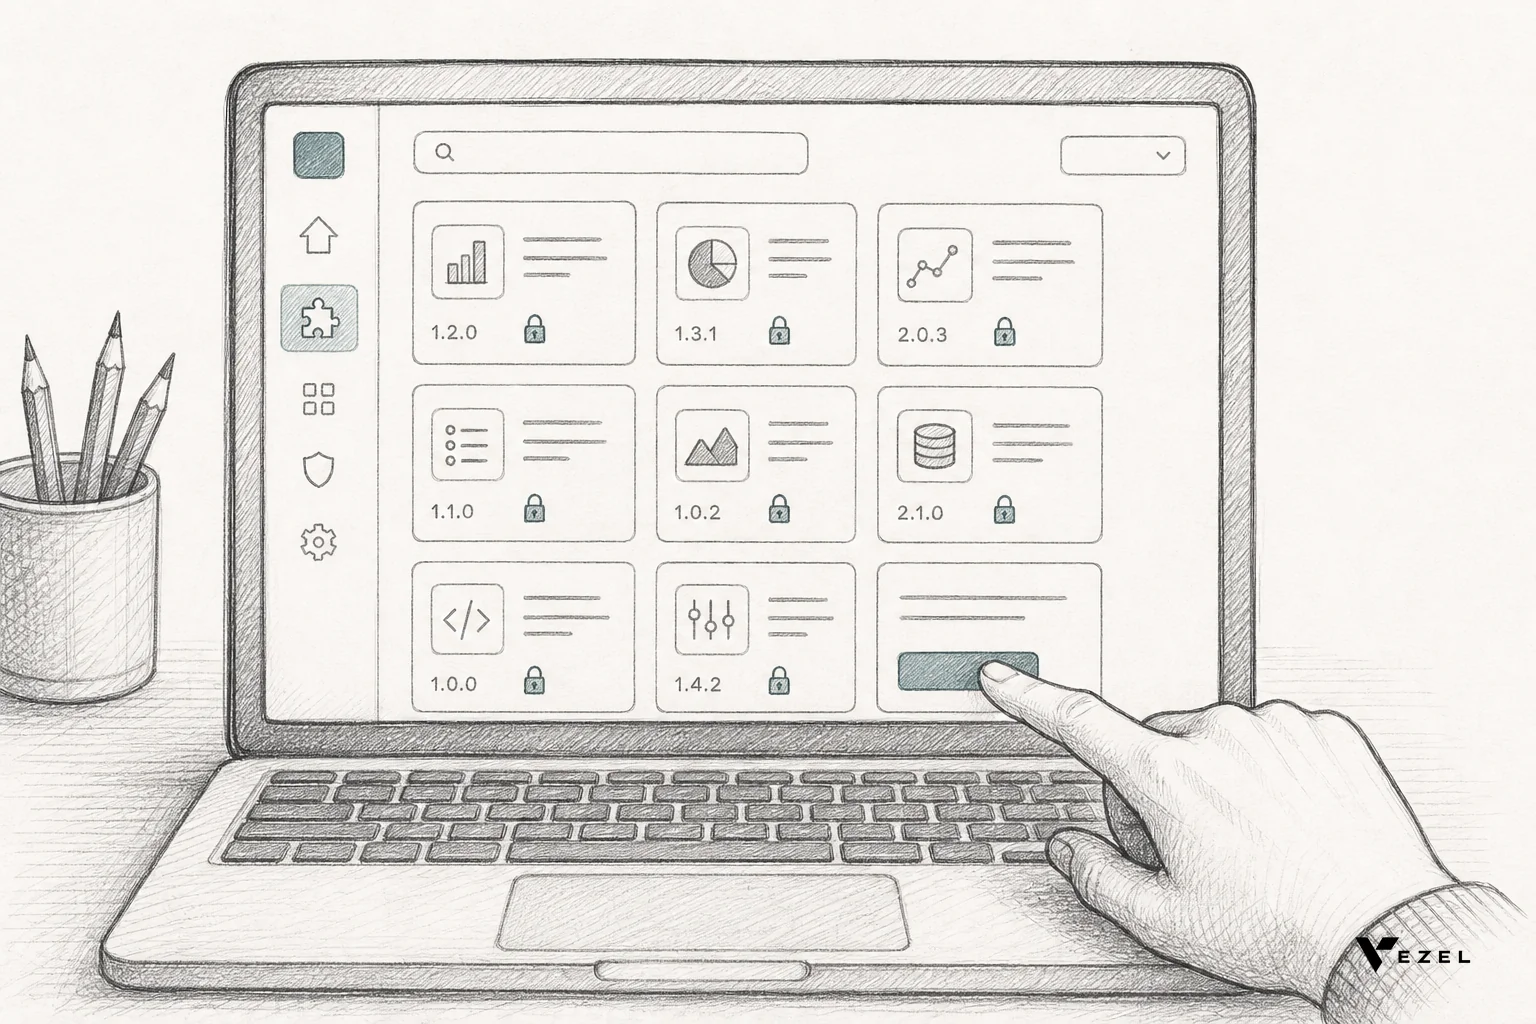
- It's durable and reusable. Unlike a chat answer that disappears when the session ends, the report becomes a permanent, installable part of that customer's account, and it can be published into a governed marketplace so other teams at the same company, or across similar accounts, can discover and adapt it.
This is the difference between AI that answers a question once and AI that becomes part of a customer's daily toolkit. If you want the deeper mechanics of how dashboard generation like this works under the hood, how to build custom dashboards inside your SaaS walks through the architecture. Vezel's book a demo option is also a fast way to see this pattern applied to your own platform's data model.
5. Map the Rollout: How Supply Chain SaaS Teams Deploy Custom Reporting in Weeks, Not Quarters
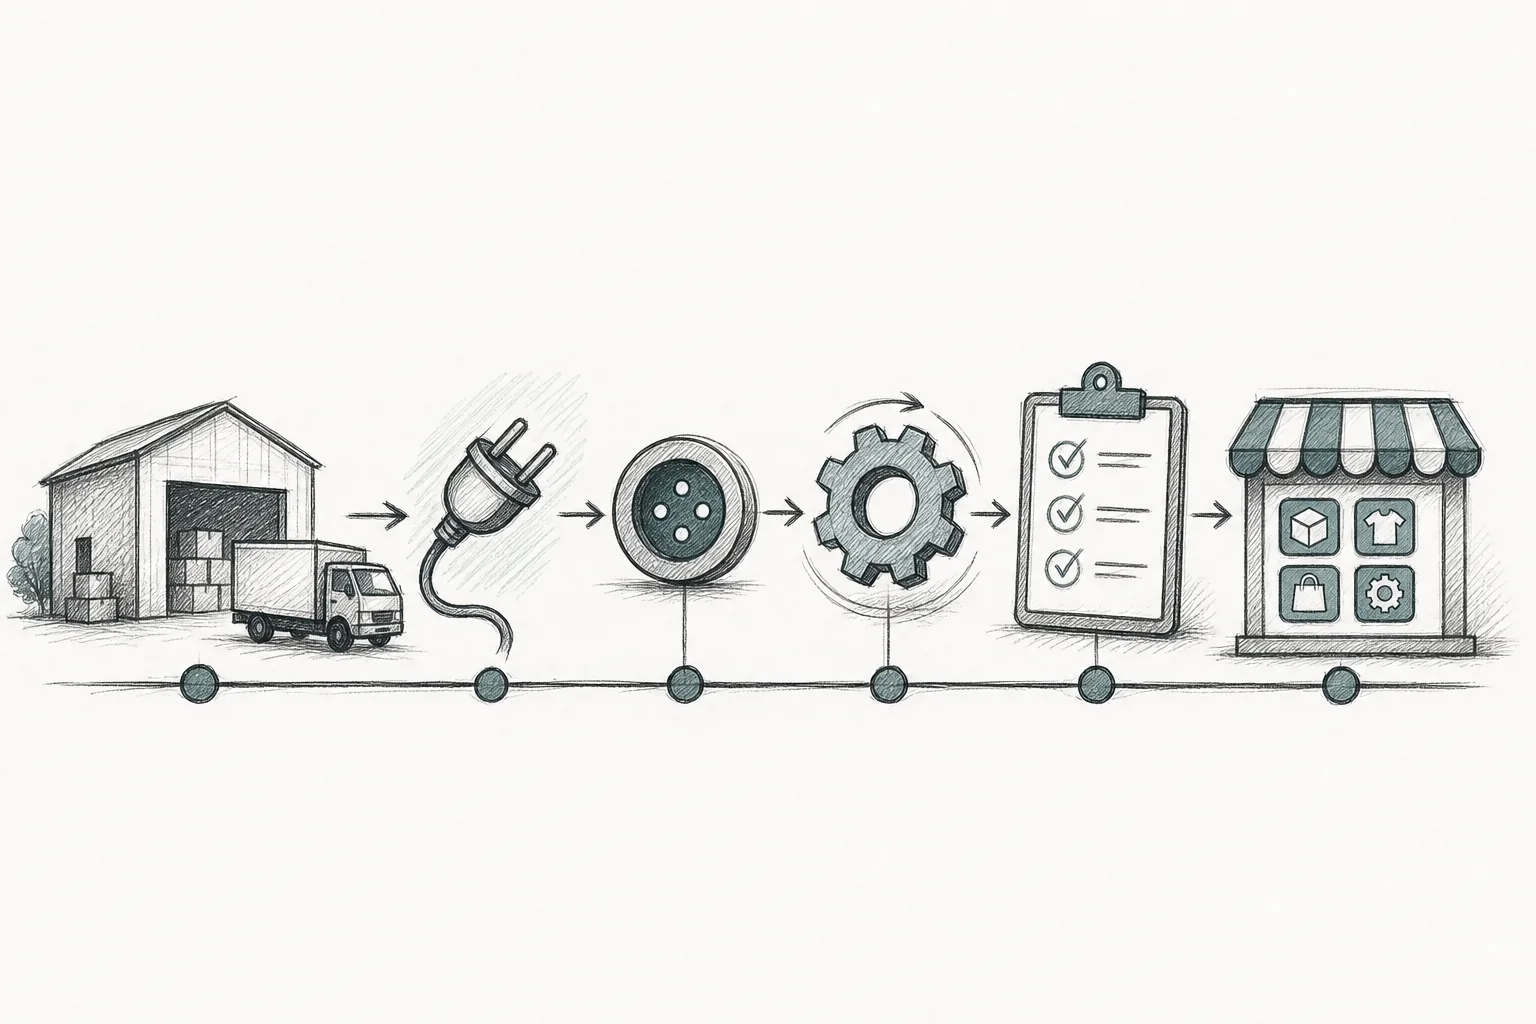
Rolling out self-serve reporting doesn't require rebuilding your platform. The typical integration path looks like this:
- Connect the API surface. Most implementations start with an OpenAPI specification covering shipment, order, inventory, and carrier data, so the extension layer can automatically discover what data exists and how it's structured, rather than requiring engineers to hand-map every endpoint.
- Map security to existing roles. Shipper admins, dock supervisors, procurement leads, and carrier partners each already have defined permissions in your platform. That mapping carries over directly, so a generated report can never surface data a user wasn't already allowed to see.
- Apply your design system. Colors, fonts, and layout patterns get configured once so every generated report looks native rather than like an add-on from a third-party tool.
- Seed the marketplace with examples. A handful of first-party reports, an OTIF scorecard, a dwell-time tracker, a landed-cost breakdown, give enterprise clients a starting point they can copy and adjust instead of starting from a blank page.
- Let clients (or your CS team) build live. During onboarding, or even mid-sales-call, a solutions engineer can describe the exact report a prospect is asking for and show it running on that prospect's own sample data before the contract is signed.
Most teams see this whole integration land in roughly two weeks, not the months a bespoke dashboard build typically takes. From there, enterprise clients keep refining reports conversationally, "also break this out by lane," "add a column for detention charges", and version history means any change can be rolled back if something looks off. If you want to see this live, See How It Works walks through the exact steps on a sample supply chain data set.
6. Measure What Changes When Reporting Becomes Self-Serve
The numbers behind this shift are the reason it's getting attention beyond early adopters. Production deployments of embedded, self-serve reporting and extension tools report adoption in the 85-95% range, compared with the typical 20-40% adoption of a standard feature release. Day-30 retention among users who build or use a custom report often lands in the high 80s, well above the 35-40% one-month retention figures commonly cited across B2B SaaS overall.
Support tickets tell a similar story. Teams that shift reporting requests to self-serve commonly see 30-35% fewer "can you build me a report" tickets, because the ops team doing the asking can now build it themselves in minutes. Sales teams report shorter cycles too: a solutions engineer who can build the requested scorecard live during a demo, instead of promising it "on the roadmap," closes deals that would otherwise stall on a customization requirement. And for accounts that expand their own reporting over time, some deployments report net revenue retention gains in the 20-plus percentage-point range, since teams that build more workflows tend to expand into higher tiers to support more users and more data.
Just as important: fewer spreadsheets. When enterprise clients can build the report they need inside the platform, the incentive to export data into an unofficial BI tool or a shared spreadsheet drops sharply, which shrinks the shadow IT footprint that quietly competes with your product for the customer's trust. For a broader look at that risk, see how to prevent shadow IT in your SaaS platform, and for the sales-cycle angle specifically, how to shorten your enterprise SaaS sales cycle.
Frequently Asked Questions
Is self-serve custom reporting safe from a data governance standpoint?
Yes, when it's built the right way. The generated reports should inherit the same authentication, role-based permissions, and row-level access rules already enforced in your core product. A user who can't see certain shipment or pricing data in the platform shouldn't be able to see it in a report they build either. Every generation and publishing event should also be logged for audit purposes, which matters a great deal for supply chain clients operating under compliance-heavy contracts.
Do enterprise clients need technical skills to build their own reports?
No. The entire premise is plain-English description rather than SQL queries or drag-and-drop query builders. An ops manager who can describe what they want to see, "carrier performance by lane, flagged when below target", gets a working dashboard without writing a query or opening a ticket.
How is this different from just giving clients access to Tableau or Power BI?
Those tools require exporting data out of your platform, which means re-implementing permissions elsewhere and creating a second system your team doesn't fully control. Embedded, self-serve reporting stays inside the product the client already logs into, connected to live data, under the same security model, with no separate export pipeline to maintain.
How long does it take to launch self-serve reporting inside an existing supply chain SaaS platform?
Most integrations connect through an existing API or OpenAPI spec, map to current user roles, and get seeded with a few example reports within roughly two weeks. That's a fraction of the time a single bespoke enterprise dashboard build typically takes today.
Turn Reporting Requests Into Your Competitive Advantage
Every supply chain SaaS company eventually hits the same wall: enterprise clients don't want your dashboard, they want their own view of their own operation, and no roadmap can ship enough custom reports to keep up with that demand one request at a time. The platforms winning enterprise deals now are the ones that stopped treating reporting as an engineering ticket and started treating it as something the client builds themselves, safely, on real data, inside the product they already trust.
If custom reporting requests are stacking up in your backlog or stalling deals in your pipeline, it's worth seeing what self-serve, embedded reporting looks like on your own platform's data. Book a demo to walk through it with your own use case, start your free trial to explore it hands-on, or talk to an expert about what a rollout would look like for your enterprise accounts. Your next renewal conversation shouldn't hinge on a feature that's still three quarters out.