

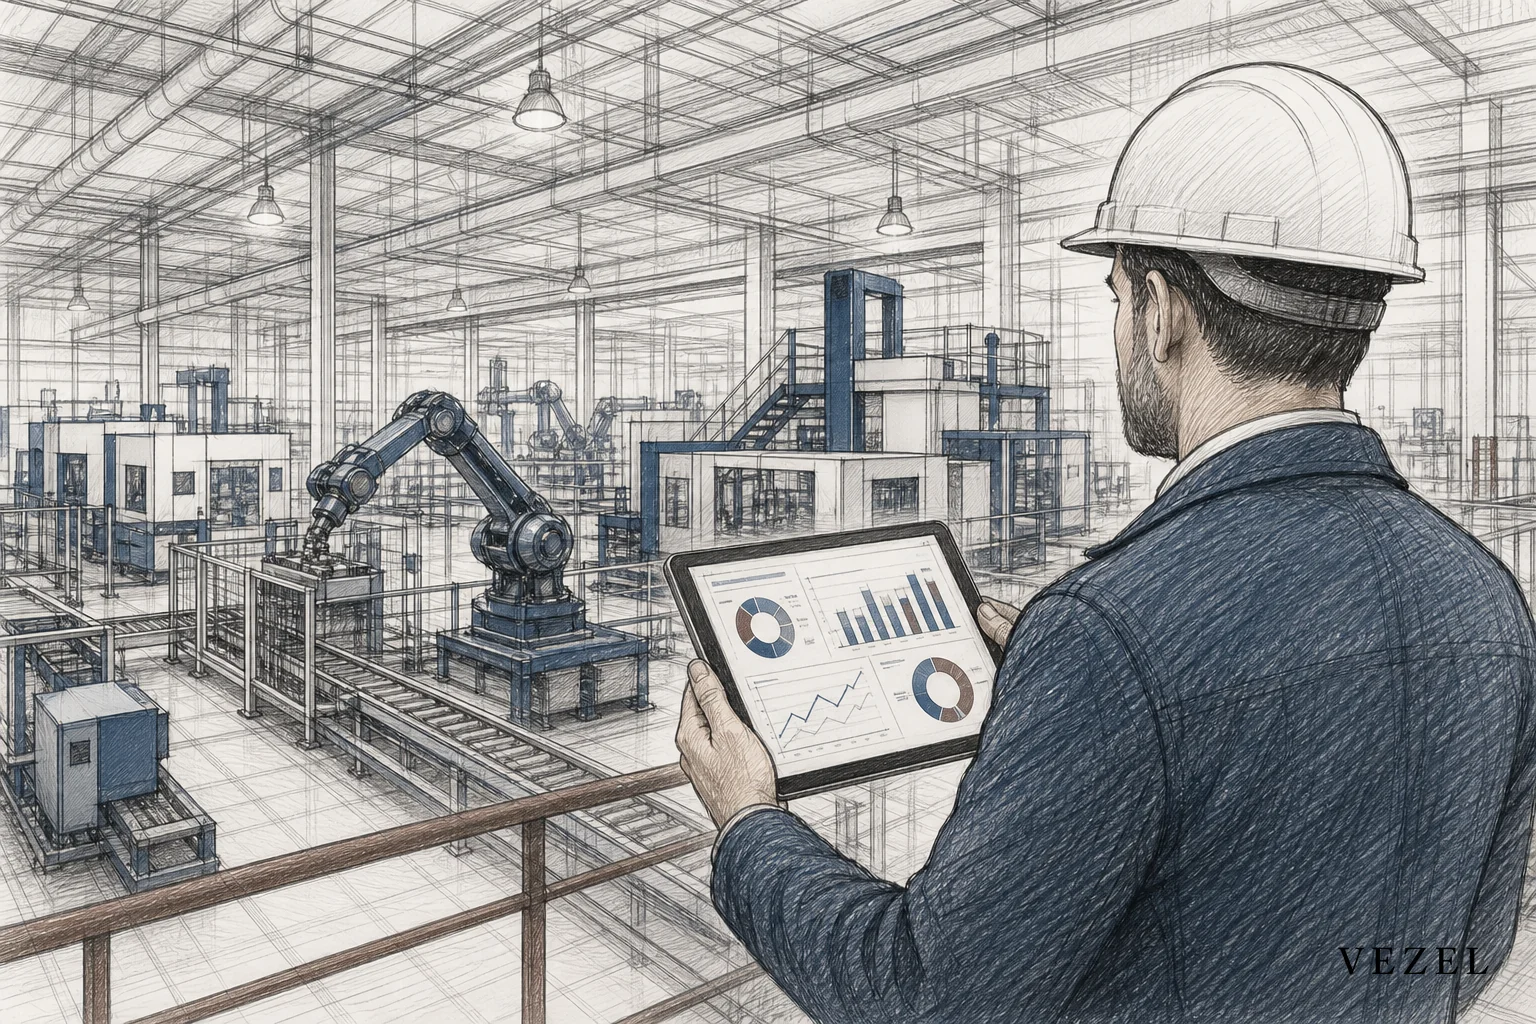
Custom reporting for manufacturing SaaS platforms means letting each plant build its own OEE views, scrap-rate breakdowns, and downtime reports in plain English, directly inside the MES or production platform it already logs into. The report connects to live production data and inherits the plant's existing user permissions, so engineering never has to open a ticket to build a one-off view for a single customer's floor.
Key Takeaways
- Plant-level variance drives the demand: one customer defines efficiency by OEE, another by scrap rate, another by shift-level throughput, and no single dashboard satisfies all three.
- Plain English replaces engineering tickets: plant managers describe the report they need in natural language, and it's generated against live data without a developer involved.
- Permissions inherit automatically: a report built by one plant manager only shows the lines, shifts, and suppliers that manager is already authorized to see.
- Engineering backlog shrinks: reporting requests that used to consume 30-40% of custom dev capacity move to a self-serve layer instead of the roadmap.
- Sales cycles shorten: prospects who previously stalled a deal waiting on a custom KPI report can build it themselves during a trial or demo.
At a Glance: Manufacturing Custom Reporting Options
| Approach | Speed to Deliver | Engineering Load | Inherits Permissions? | Feels Native to Product? |
|---|---|---|---|---|
| Custom development | Weeks to months | High | Manual rebuild each time | Yes |
| Spreadsheets / manual exports | Hours to days | Low, but recurring | No | No |
| Standalone BI tool | Days to weeks | Medium | Rarely, needs re-auth | No |
| Internal tool builder (e.g., Retool) | Days | Medium, dev-dependent | Rebuilt per instance | No |
| Embedded AI extension | Minutes | Near zero | Yes, automatic | Yes, white-labeled |
Why Every Plant Measures Efficiency Differently
Ask three plant managers what "efficiency" means and you'll get three different answers. A discrete manufacturer running an assembly line cares about Overall Equipment Effectiveness (OEE), tracking availability, performance, and quality against a shift schedule. A process manufacturer running continuous batches cares more about yield and scrap rate. A contract manufacturer juggling multiple customer SKUs cares about changeover time and on-time delivery by work order.
None of these customers are wrong. They're running different operations with different bottlenecks. A manufacturing SaaS platform serving all three has to pick a default reporting model, and that default will never be everyone's primary metric. The gap between the shared product and what each plant actually tracks on its whiteboard is what the Adaptive SaaS manifesto calls the SaaS Adaptation Gap, and manufacturing is one of the clearest examples of it in action.
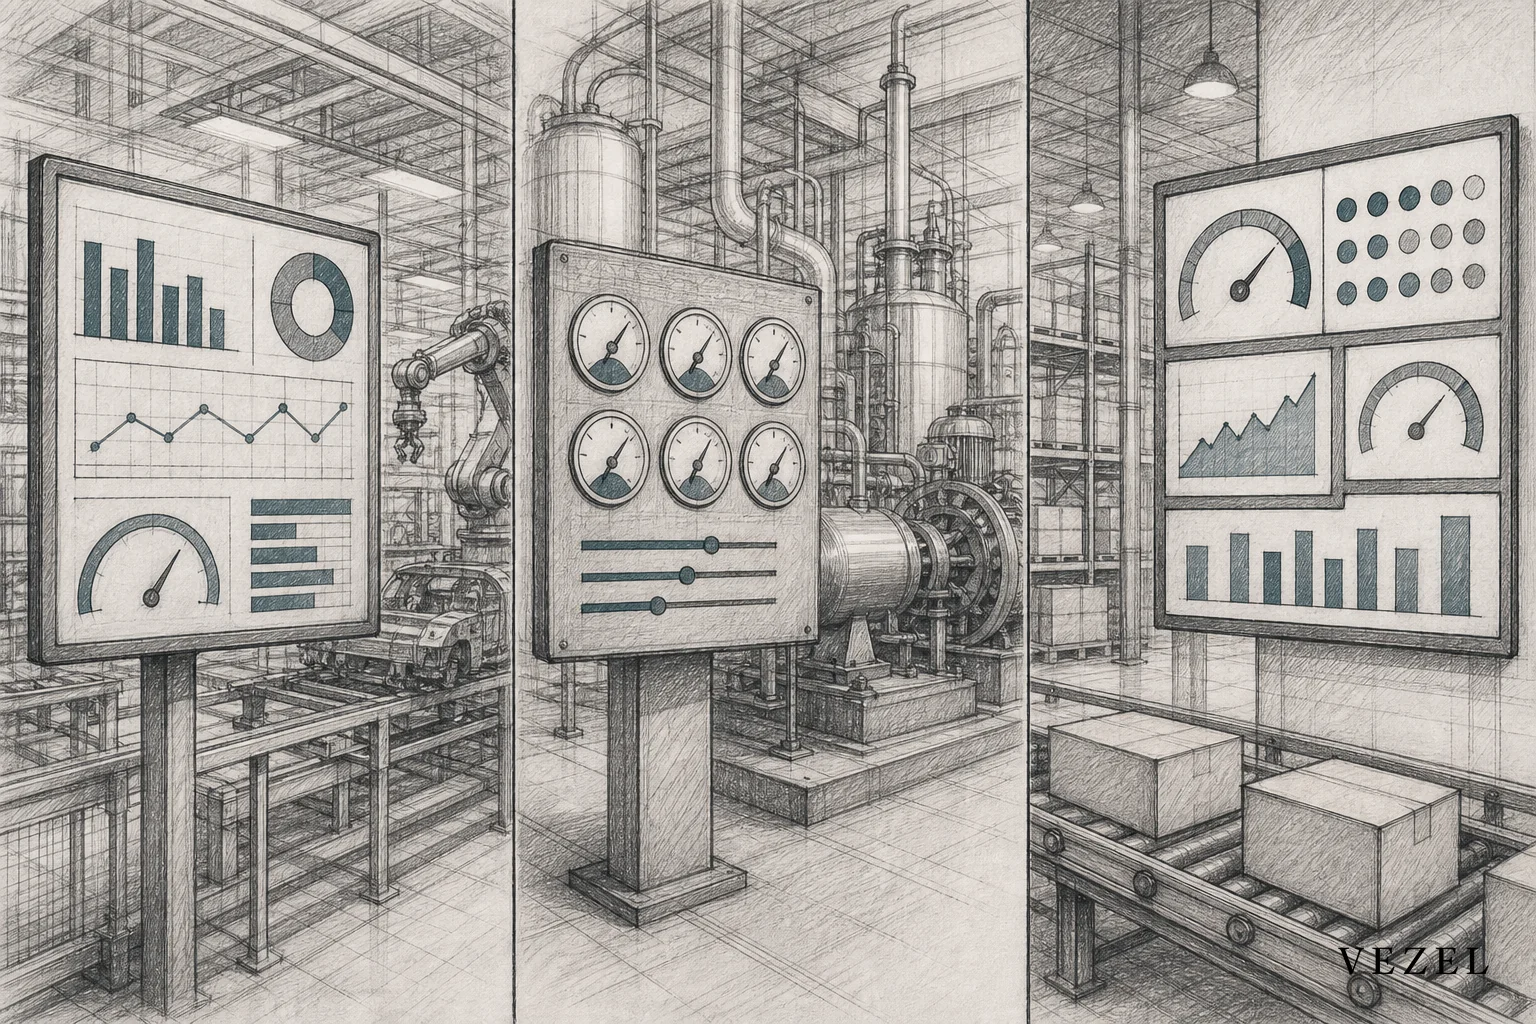
Shift patterns add another layer. A plant running three shifts wants reports broken out by shift supervisor so accountability is clear. A plant running two twelve-hour shifts wants a completely different breakdown. Multiply that by line number, product family, and supplier batch, and it becomes obvious why a single shared dashboard can never satisfy every customer at once.
The Manufacturing SaaS Adaptation Gap
Every manufacturing SaaS vendor knows the cycle. A plant manager requests a downtime report broken out by root cause code. Product logs it. Engineering estimates the work. It gets prioritized against a hundred other requests from other plants asking for their own variation of the same idea. Months pass. The plant manager builds a spreadsheet instead.
This isn't a failure of the product team. It's basic math. A shared codebase cannot absorb an unlimited number of plant-specific report definitions without becoming unmaintainable. Teams that want to reduce SaaS engineering backlog from enterprise requests eventually run into this same wall regardless of the vertical, but manufacturing hits it especially hard because operational metrics vary so much plant to plant, even within the same customer account.
Why AI Chat Alone Doesn't Solve Plant Reporting
Plenty of manufacturing SaaS platforms have already added an AI assistant that can answer a question like "what was line 3's downtime yesterday." That's useful. It's also not the same thing as solving the reporting gap.
An AI assistant that answers a question in a chat window disappears the moment the conversation ends. A plant manager needs a downtime report that persists, updates automatically every shift, and shows up on the same dashboard the whole team checks every morning. That's a capability, not a one-time answer. This distinction matters because it's the difference between AI improving how customers interact with a product and AI actually adapting the product itself, which is the core argument behind Adaptive SaaS as an architectural approach rather than a chat feature bolted on top.
How Embedded AI Extensions Enable Custom Reporting for Manufacturing SaaS Platforms
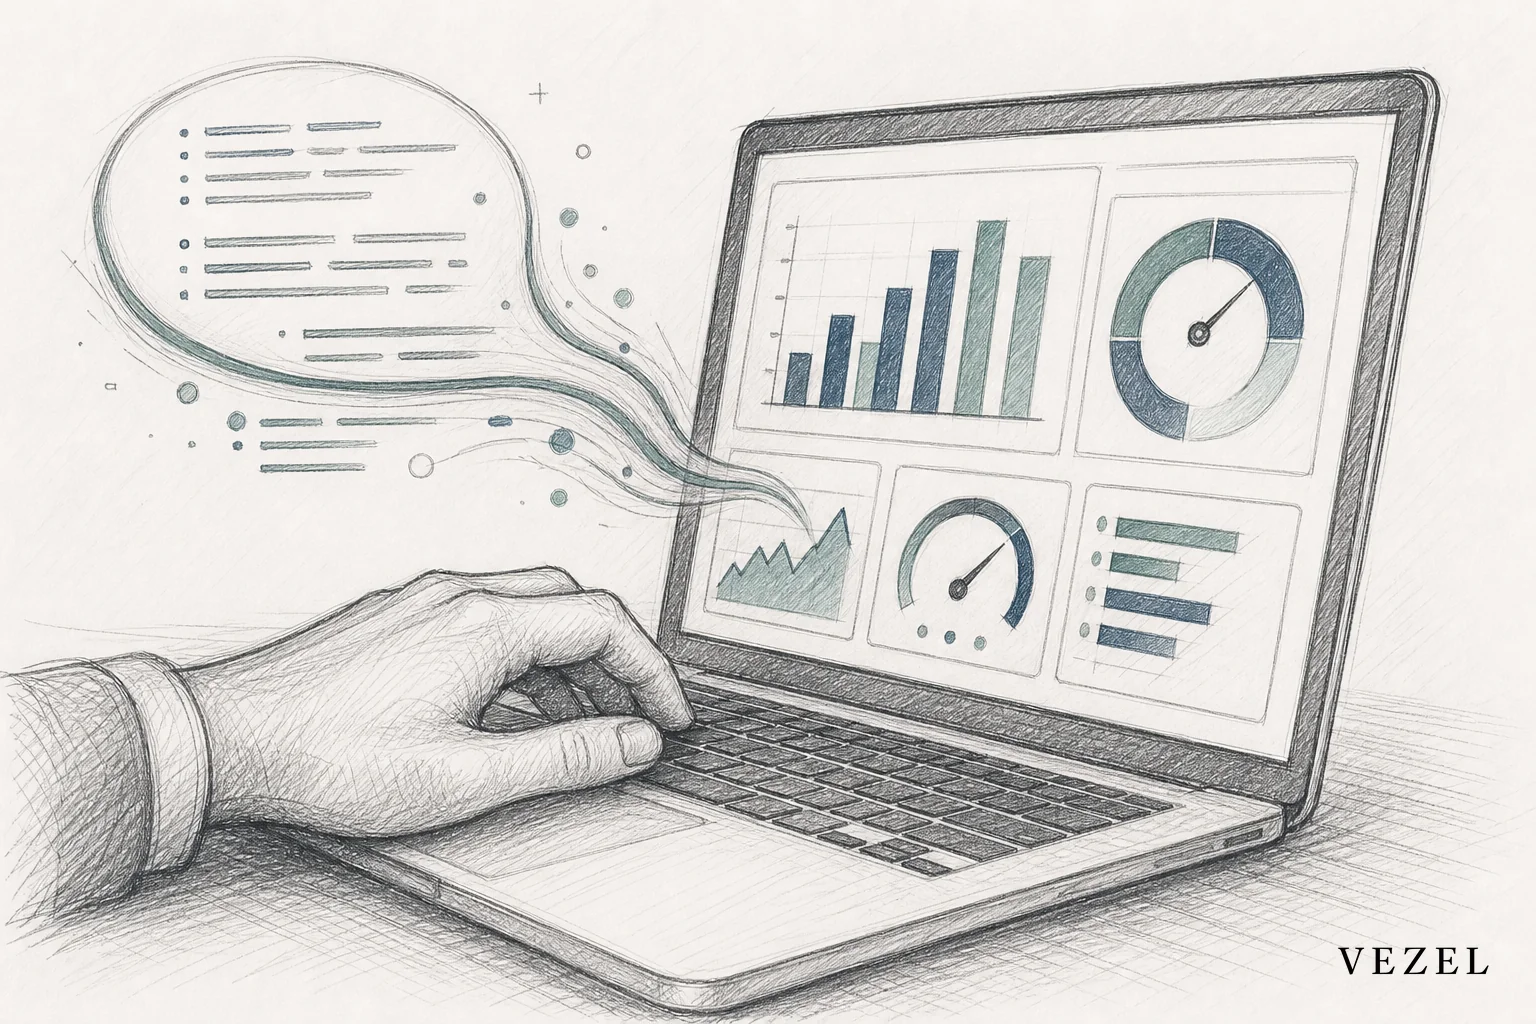
Embedded AI extensions close this gap by letting the plant manager, not the engineering team, build the report. The plant manager describes what they want in plain English, something like "show me scrap rate by shift for the injection molding line over the last 30 days," and the extension generates a working report connected to live production data.
Three things make this work in practice:
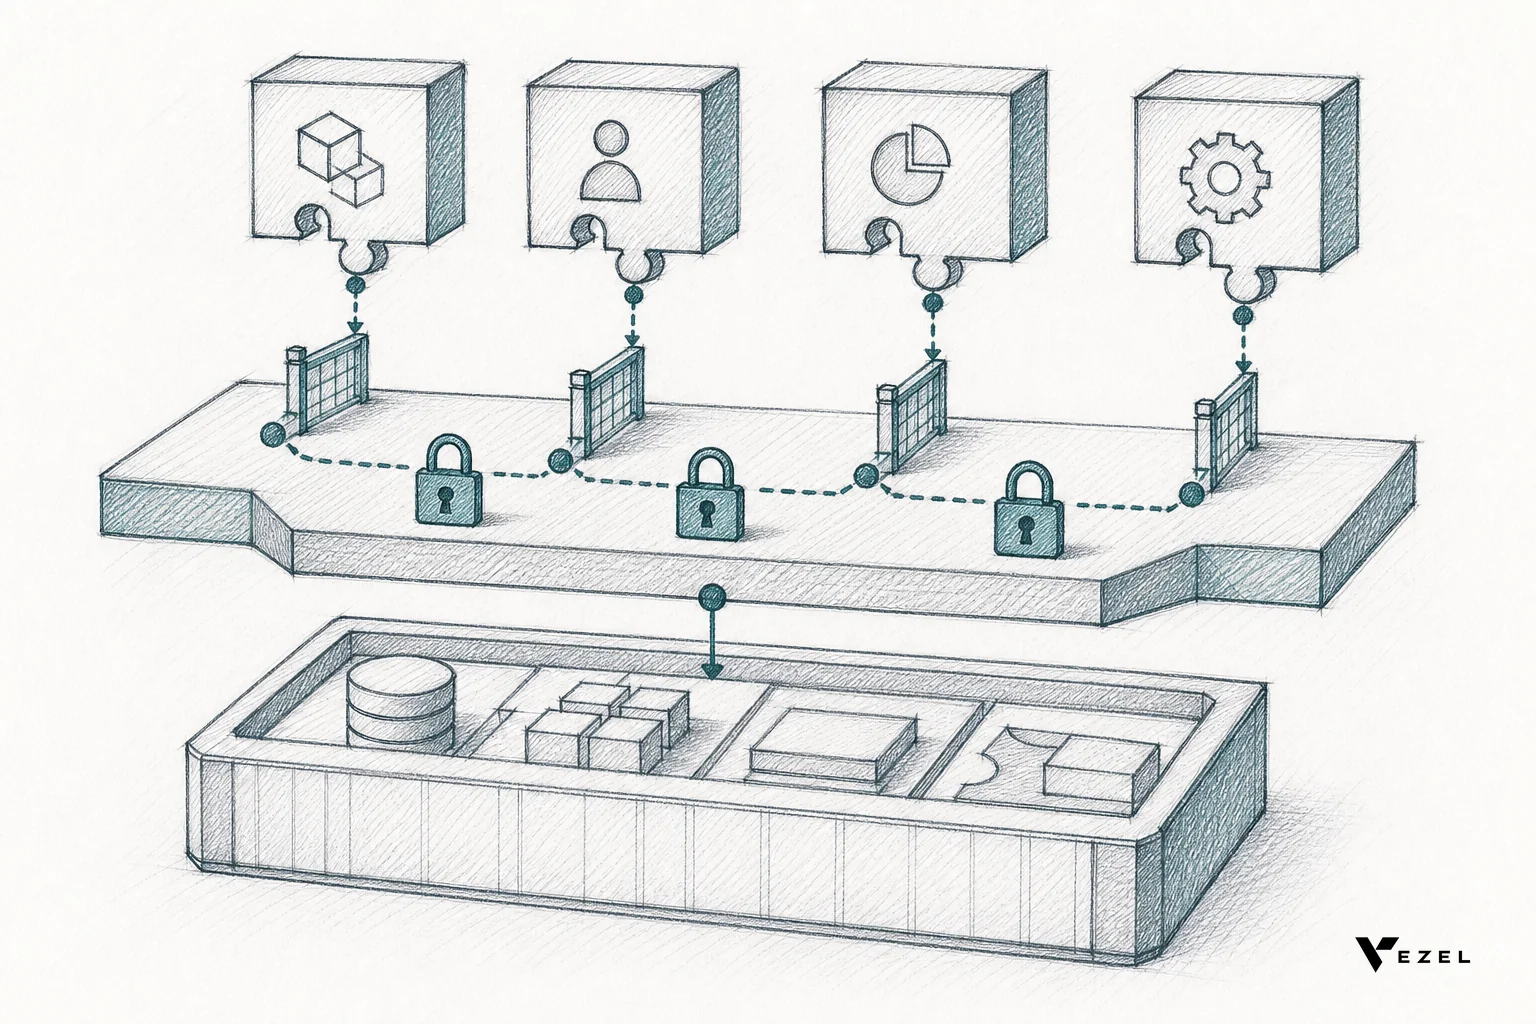
- API auto-discovery: the extension maps automatically to the manufacturing platform's existing data model, whether that's work orders, machine sensor feeds, or quality inspection records, without a custom integration project.
- Security inheritance: the report only surfaces data the requesting user's role already permits, using the platform's existing authentication and row-level access controls rather than a separate login or admin token.
- White-labeled delivery: the finished report looks and feels like a native part of the manufacturing platform, matching its design system, not a bolted-on third-party tool.
This is a different model from building an internal dashboard yourself with a tool like Retool. Those tools are built for your own engineers to use on trusted internal data. Manufacturing customers need something that works for their operators and plant managers, safely, at scale, which is the distinction covered in Internal Tool Builders vs Customer-Facing Extensibility.
Can I Connect My Own AI Client to My Own SaaS Accounts?
This is a question a lot of platform teams and even end customers ask directly: can I connect my own AI client to my own SaaS accounts and just point it at the data myself? Technically, yes, through APIs and personal access tokens. Practically, it's a governance problem waiting to happen.
A bring-your-own AI client typically means a separate login, a separate token with broad scope, and no guarantee it respects the same row-level permissions the platform enforces natively. That's exactly the kind of shadow IT risk manufacturing SaaS vendors are trying to avoid, and it's a big part of why preventing shadow IT in SaaS platforms has become its own concern for product leaders. Embedded extensions solve the same underlying need, letting customers point AI at their own data, without introducing a second identity system or an unscoped token nobody's tracking.
What Manufacturing-Specific Reports Look Like in Practice
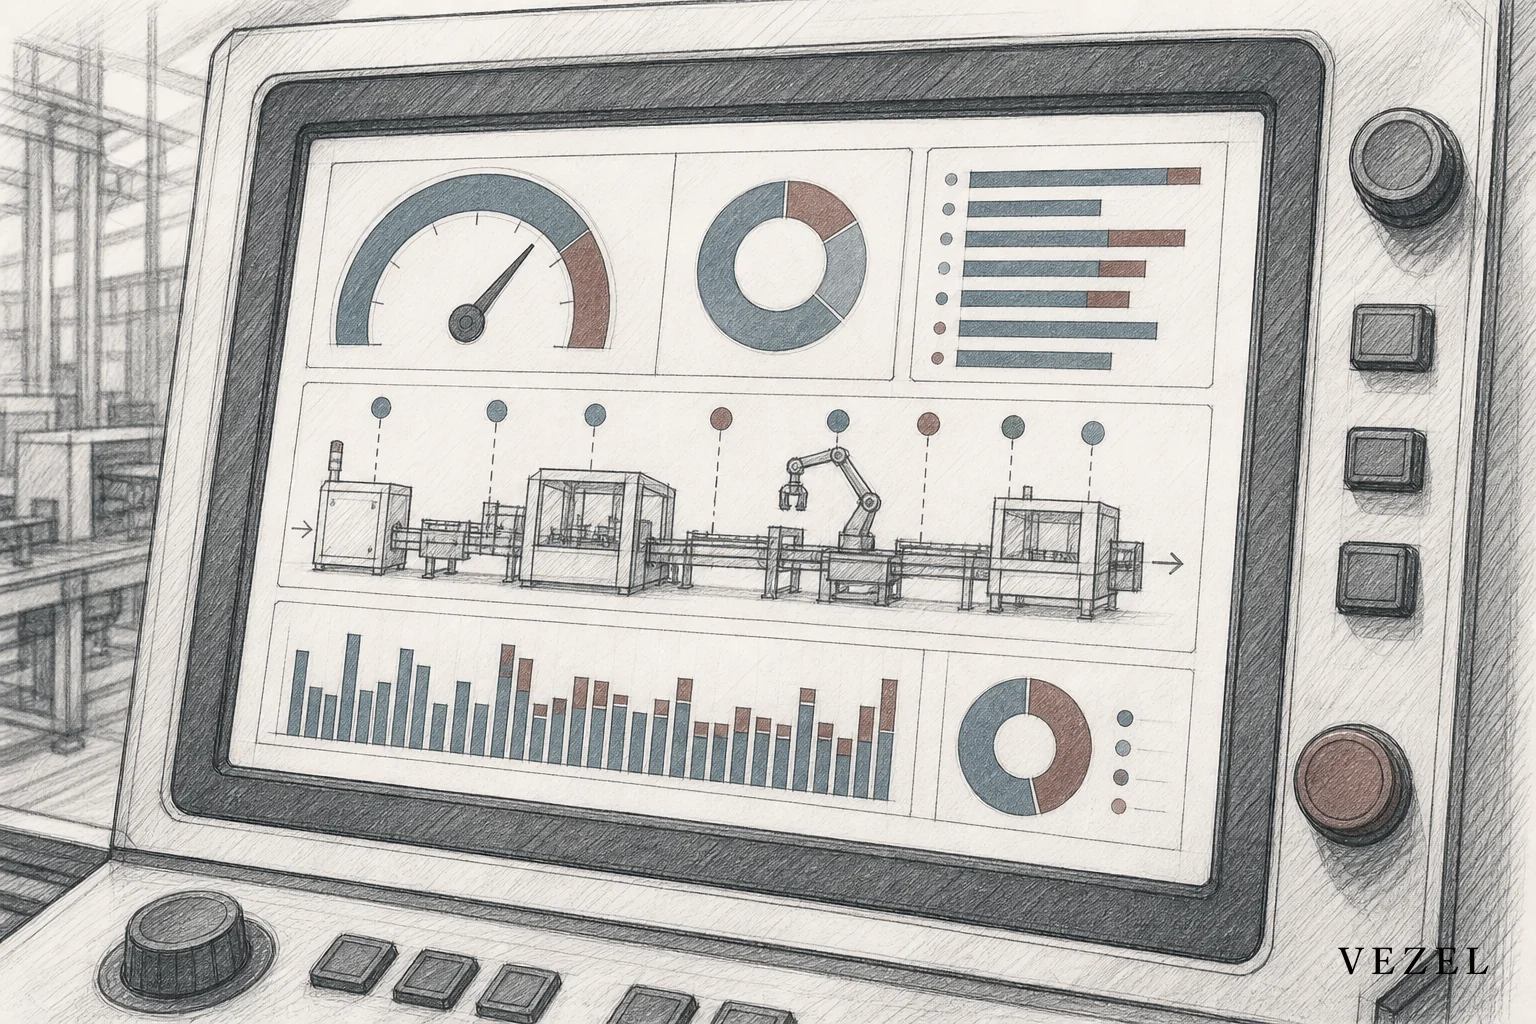
Once plant managers can build their own reports, the variety that shows up looks a lot like the whiteboards already hanging in every plant office:
- OEE dashboards by line: availability, performance, and quality tracked per production line, updated every shift.
- Scrap and rework reports by shift: broken out by operator, machine, or material batch to spot recurring quality issues.
- Supplier quality scorecards: defect rates and on-time delivery tracked per supplier, something quality managers previously exported to a spreadsheet.
- Downtime root cause reports: categorized by mechanical failure, changeover, material shortage, or planned maintenance.
None of these are exotic requests. They're the ordinary variation you'd expect across discrete, process, and contract manufacturing customers, which is exactly why building custom dashboards inside your SaaS has to be self-serve rather than something engineering handles case by case.
Manufacturing vs Supply Chain Reporting: A Related but Different Problem
It's worth separating manufacturing reporting from a closely related problem: supply chain reporting. A manufacturing plant manager cares about what happens on the production floor, machine uptime, scrap, changeover time. A supply chain team cares about what happens between facilities, carrier SLAs, shipment exceptions, supplier lead times.
Both are examples of customers needing plant- or network-specific views a shared product can't anticipate, but the metrics themselves don't overlap much. If your platform also touches logistics or supplier network visibility, it's worth reading How Supply Chain SaaS Can Offer Custom Reporting alongside this piece, since the underlying extension mechanics are similar even though the report content is different.
Getting Started: A Governed Path to Self-Serve Reporting
Rolling this out doesn't require rebuilding your reporting stack overnight. A practical path looks like this:
- Pilot with one plant customer who's already asked for a custom KPI view engineering hasn't shipped.
- Connect the extension to existing APIs using auto-discovery so it maps to production data you already expose.
- Confirm permission inheritance so the pilot report respects the same roles and access rules already in place, a step covered in more depth in How to Inherit Row-Level Permissions in SaaS Tools.
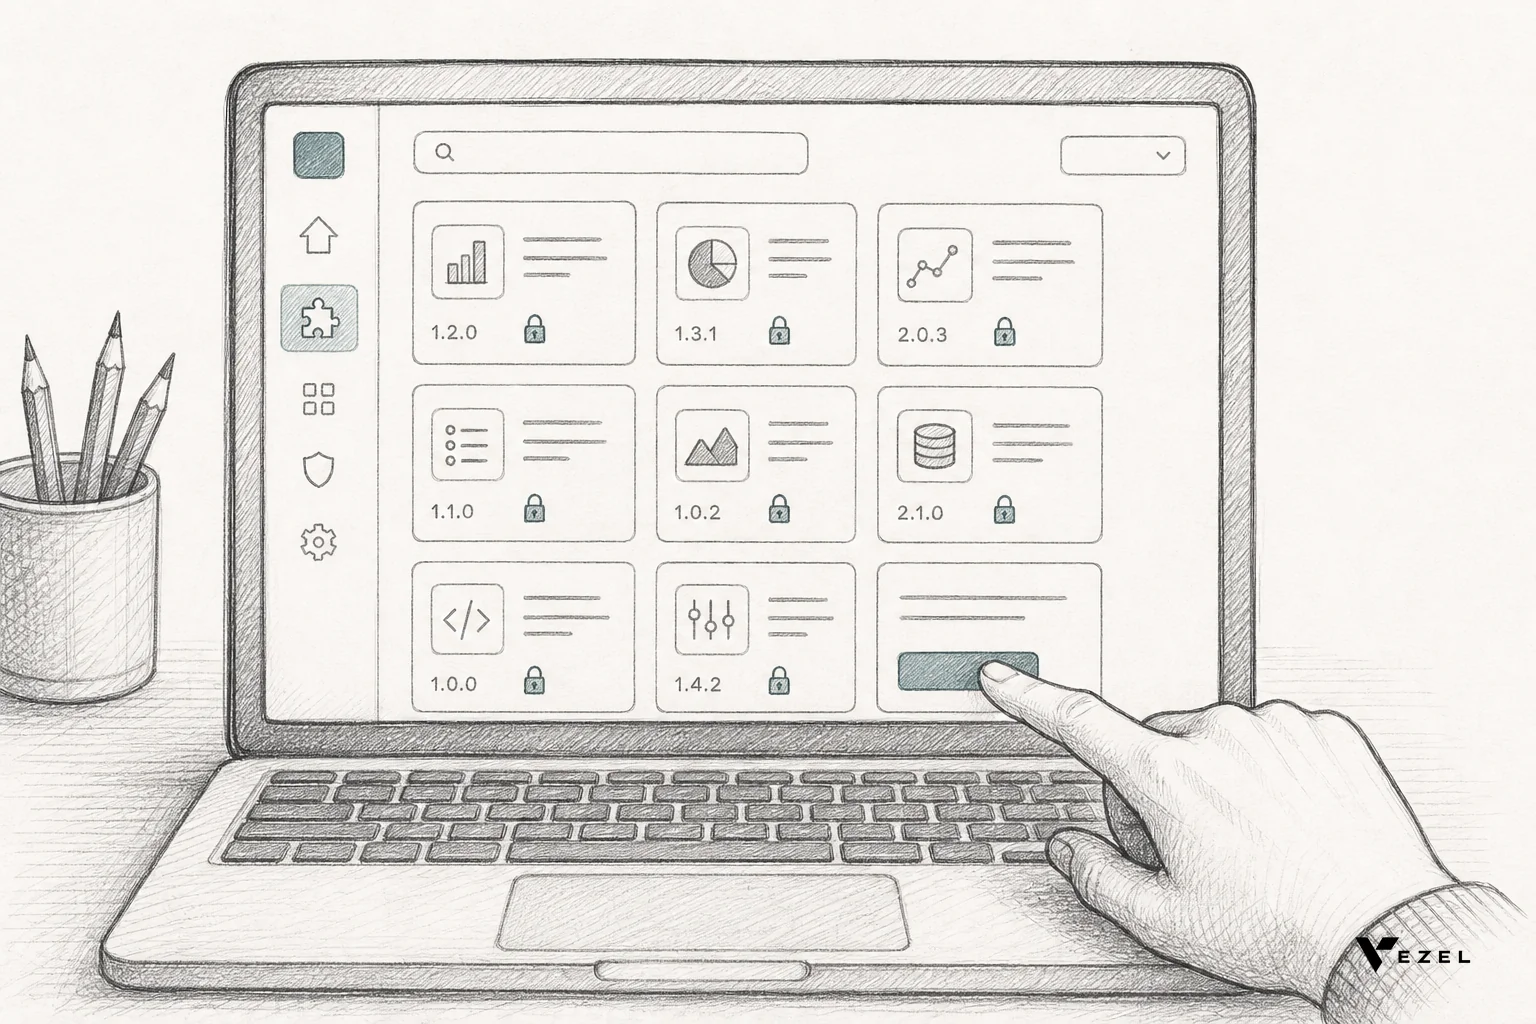
- Publish through a governed marketplace so the report is versioned, discoverable, and can be rolled back if needed, rather than living as an unmanaged one-off.
- Expand to more plants once the pilot proves out, letting each new customer build their own variation instead of filing a new request.
Reporting is often the easiest starting point for a broader extensibility strategy. Once plant managers can build reports, the same underlying capability extends naturally to workflows, like approval routing for maintenance requests, which is worth exploring in How to Embed a Workflow Builder in Your SaaS.
If your engineering team is currently the bottleneck between every plant's KPI request and a shipped dashboard, that bottleneck is solvable without adding headcount. Book a demo to see how Vezel's embedded AI extensions let manufacturing SaaS customers build their own live reports in plain English, or see how it works end to end, from API auto-discovery to governed publishing. If you'd rather talk through your specific data model and permission structure first, talk to an expert before your next plant-level renewal conversation turns into another custom dev request.